
. Photo by <a href=\"https://www.facebook.com/jan.humphreys.79/posts/pfbid0JLoZ9bemcB7zZ1tFVwbDN9ettxzYBEZfD67ZGQ34EN8GN2jSWfC2GX39RiGHqHt2l\" target=\"_blank\">Jan Humphreys</a>.")

 on January 24th. According to boaters, this was the first time conditions allowed for ice boating since 2018.")
 on December 9th, 2024. December helped ameliorate drought conditions, but not eliminate it. Photo by Julian Leshay Guadalupe/NorthJersey.com")
 on October 24th, 2024, revealing a \"ghost bridge\" that had been used by stagecoaches on the original roadbed of the Paterson-Hamburg Turnpike. Photo by Andre Malok/NJ.com.")
Decision-Making Dilemma: May & Spring 2021 Recaps
. Photo by Michelle Brooks.")
Weather often varies from week-to-week and even day-to-day during the spring transition season. Such was certainly the case in spring 2021, as will be recapped later in this report. However, when it came to such “weather indecision,” May 2021 took the cake. Starting off somewhat damp with seasonable temperatures, a prolonged period of exceedingly dry weather ensued, first accompanied by cooler-than-normal temperatures and frosty mornings, and later by summer-like heat. As several wildfires broke out and soil moisture vanished, concerns of early-summer drought arose. Then along came one of the coolest Memorial Day weekends on record, accompanied by more than an average May’s worth of rain in some locations. This led to frequent decision making amongst farmers, gardeners, water resource managers, utility companies and customers, and day trippers. All were left wondering what might come next! Cicadas perhaps?
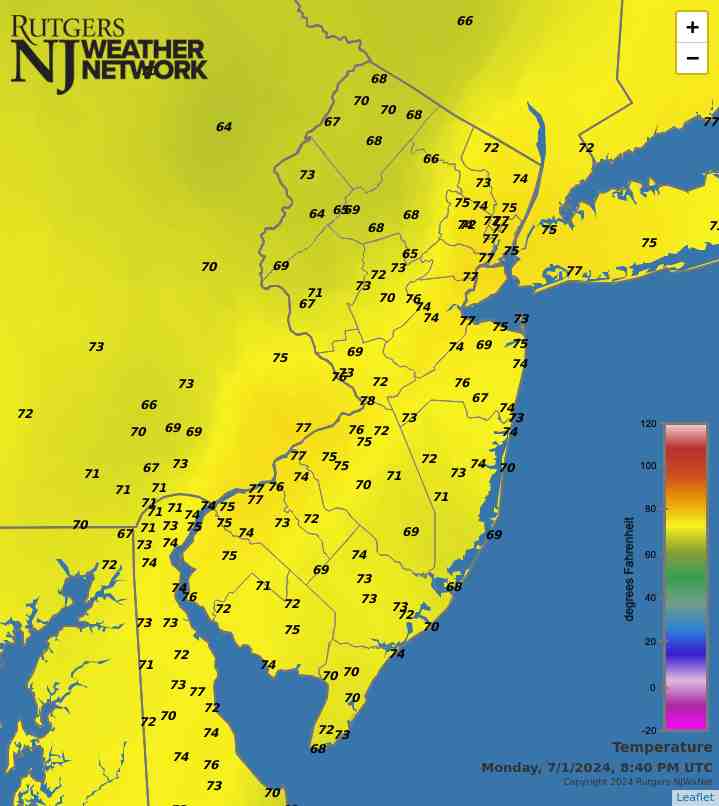
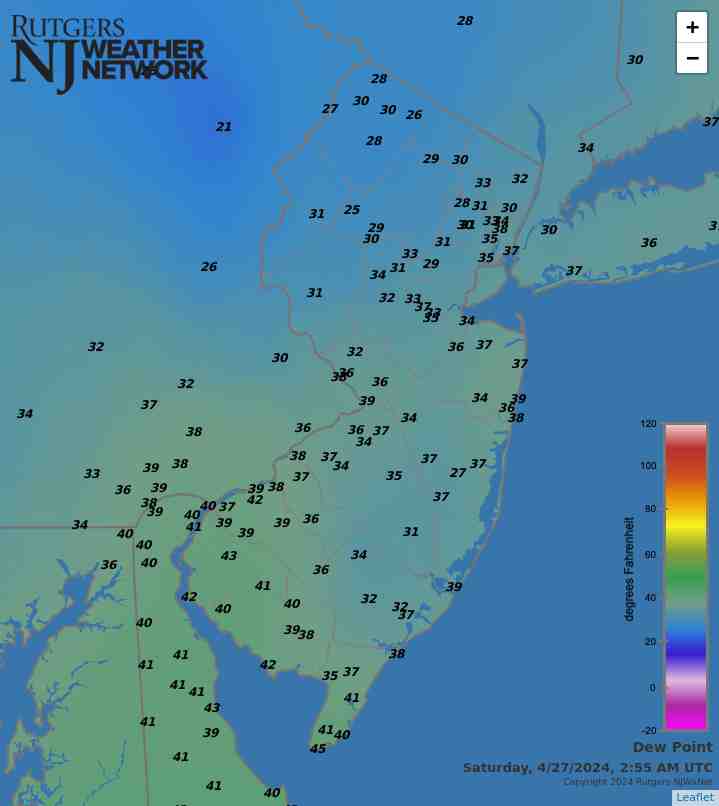
With the thermometer up and down throughout May, the statewide average temperature of 61.0° was just 0.2° below the new 1991–2020 normal. This ranked as the 47th mildest May since 1895. The average maximum of 73.0° was 0.7° above normal, while the 49.0° average minimum was 1.2° below normal. This is illustrative of a month that had many clear days and cool nights with low humidity. Despite dry conditions for most of the month, monthly precipitation came in close to normal, averaging 3.95” across NJ. This is 0.20” above normal, ranking 48th wettest of the past 127 years. Far south and west central areas were driest, while the central coast and northeast saw the most rain. Unlike last May, no snow was observed.
 on April 25th. This year's display included 90,000 daffodils. Photo by Dave Robinson.")
 on March 14th. Photo from the New Jersey Forest Fire Service Facebook page.")
 on February 15th.")

 near the morning high tide on December 17th. Photos courtesy of Life on the Edge Drones.")

 CoCoRaHS station on November 12th. This was the second daily observation from this new station and the first with measurable precipitation. Quite an impressive debut! Photo courtesy of S. Daly.")
. Photo by N. Stefano.")
 on September 14th. Photo by Max Guliani.")