The first month of 2025 was cold, dry, and windy. It was the coldest January since 2014, one of the driest of the past 131 years, dew points dropped below zero or into the single digits on 23 days, and winds gusted to 40 mph or higher on 16 days. No doubt, a profitable outcome for those in the lip balm business!
Statewide, precipitation (rain and melted snow) averaged 0.92”. This was 2.57” below the 1991–2020 normal and ranked as the 3rd driest since records commenced in 1895 (Table 1). Quite a difference from last year, when January 2024 came in with 6.17”, the 7th greatest total on record. This year’s total includes rain that fell during the afternoon and evening of December 31st as the majority of National Weather Service (NWS) Cooperative stations report shortly after dawn each day with subsequent precipitation recorded on the next calendar day. For that same reason, the January total does not include rain that fell at these stations during the second half of January 31st.
| Rank | Year | Jan. Avg. Precip. |
|---|---|---|
| 1 | 1981 | 0.54" |
| 2 | 1955 | 0.63" |
| 3 | 2025 | 0.92" |
| 4 | 1970 | 0.95" |
| 5 | 1967 | 1.33" |
| 6 | 1985 | 1.40" |
| 7 | 1916 | 1.53" |
| 8 | 1896 | 1.61" |
| 9 | 1992 | 1.76" |
| 10 | 1946 | 1.78" |
Table 1. The 10 driest Januarys across New Jersey since 1895.
While quite meager, the northern and southeastern areas received the most precipitation, with the northern coast and southwest catching the least (Figure 1). The NWS northern climate division reported 0.81” (-2.69”, 4th driest), the southern division 0.99” (-2.48”, 3rd driest), and the coastal division 0.98” (-2.53”, 3rd driest).
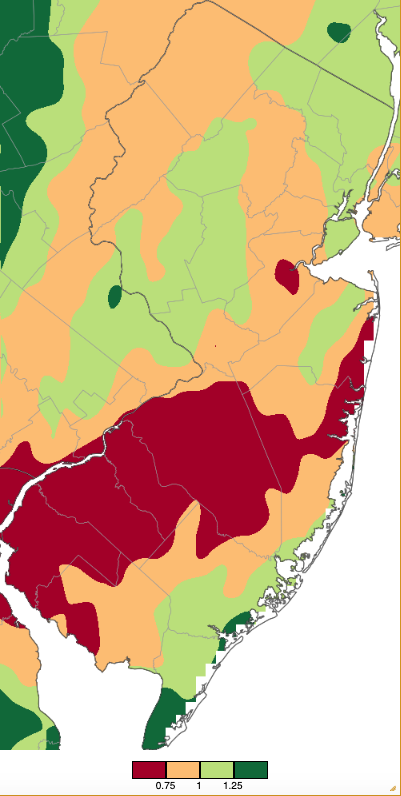
Figure 1. January 2025 precipitation across New Jersey based on a PRISM (Oregon State University) analysis generated using NWS Cooperative, CoCoRaHS, NJWxNet, and other professional weather station observations from approximately 7 AM on December 31, 2024 to 7 AM on January 31, 2025. Includes rain that fell during the PM hours of December 31st but not the PM hours of January 31st. Note the scale in inches at the bottom of the map. Totals range from 0.50–0.74” (dark red) to 1.25–1.49” (dark green).
The statewide average monthly temperature of 28.3° was 3.4° below normal, ranking as the 45th coldest of the past 131 years. The average high of 36.4° was 3.9° below normal and ranks 44th coldest. The average low of 20.1° was 3.1° below normal and ranks 50th coldest. The northern division averaged 26.0° (-2.9°, 53rd coldest), the southern division 29.6° (-3.8°, 42nd coldest), and the coastal division 30.7° (-3.7°, 44th coldest).
January snowfall averaged 6.3” across NJ. This was 0.9” below normal and ranks as the 58th snowiest of the past 131 years. The northern snow division (Warren/Morris/Essex northward) averaged 6.7” (-2.7”, 73rd snowiest), the central division (Hunterdon/Mercer/Somerset/Union/Middlesex/Monmouth) 5.8” (-1.9”, 65th snowiest), and the southern division (Burlington/Ocean southward) 6.2” (+0.5”, 46th snowiest).
Temperature
There were 11 January days when one or more of the 69 Rutgers NJ Weather Network (NJWxNet) stations achieved a high temperature of 45° or greater, but just three of them reached 50°. Maximum temperatures were above freezing at all NJWxNet stations on seven days (1st, 13th, 17th–18th, 26th, 29th, and 31st). All stations remained below freezing on five days (6th and 20th–23rd).
One of the mildest days was the 1st with Point Pleasant (Ocean County) and nearby Sea Girt (Monmouth) reaching 53°. Thirty-two stations topped out from 50°–52° and 32 from 45°–49°. Five stations got to 45° on the 2nd, then not again until the 12th when Jersey City (Hudson) and Mansfield (Burlington) reached 45°. Nine stations rose to 45° on the 17th, while three hit 49° and 39 from 45°–48° on the 18th.
Eight days passed until a mild spell brought 45° highs to some locations each of the last six days of the month. Jersey City and Woodbine (Cape May) kicked things off at 45° on the 26th. Egg Harbor Township (Atlantic) was 48° and 30 locations from 45°–47° on the 27th. Four locations got to 48° on the 28th, with 32 sites from 45°–47°. High Point Monument (HPM; Sussex) only made it to 29° that day. The 29th was the mildest day of the month with seven stations at 56°, 10 at 55°, 40 from 50°–54°, and 11 from 45°–49° (Figure 2). Only HPM was cooler at 41°. Four stations made it to 45° on the 30th. Cape May Court House (Cape May) achieved the state monthly maximum of 57° on the 31st, with 40 stations from 50°–54°.
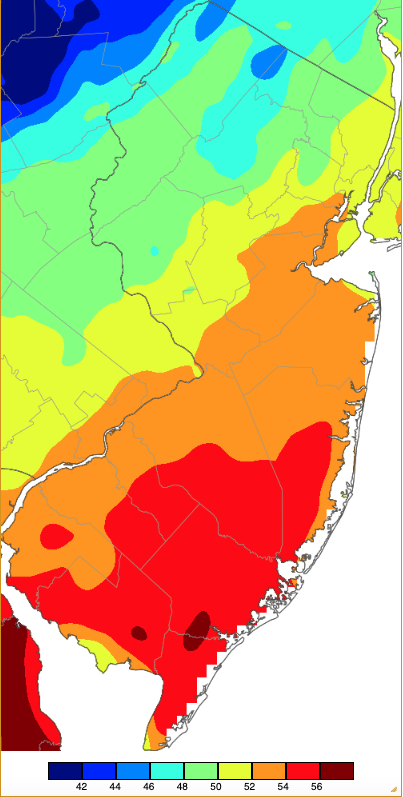
Figure 2. Maximum temperatures on January 29th based on a PRISM (Oregon State University) analysis generated using NWS, NJWxNet, and other professional weather stations. Note the 2° scale beneath the map.
Every January day had at least one NJWxNet station with a low of 32° or lower. On 25 days, all NJWxNet stations had lows below freezing (exceptions being the 1st, 2nd, 18th, 28th, 29th, and 31st). Also, indicative of the overall cold January conditions, six days found one or more stations with a daily low below zero and five in the single digits above zero. HPM fell to 7° on the 6th and 8° on the 7th. Four locations dropped to 7° on the 16th.
The 20th kicked off the coldest six-day period since the winter of 2018–2019. Sandyston (Sussex) dropped to -7°, Walpack (Sussex) -6°, and Pequest (Warren) -3°, while 20 stations sat from 1°–9°. On the 21st, Walpack reached -15°, Sandyston -14°, Pequest -10°, Hackettstown (Warren) -8°, Kingwood (Hunterdon) -6°, seven stations either -1° or -2°, and 34 from 0 to 9°. The 22nd was the coldest day of the month, with Walpack at -17°, Sandyston -16°, Pequest -13°, Kingwood -12°, three stations at -10°, seven from -3° to -9°, and 44 from 0° to 9° (Figure 3). Atlantic City Marina (Atlantic) was least cold at 14°.
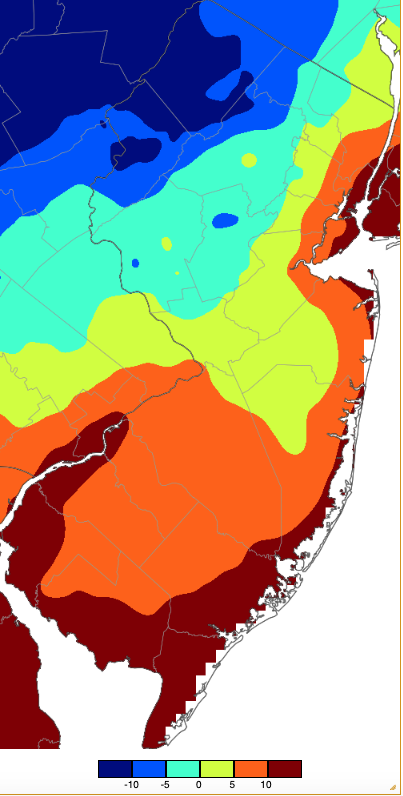
Figure 3. Minimum temperatures on January 22nd based on a PRISM (Oregon State University) analysis generated using NWS, NJWxNet, and other professional weather stations. Note the 5° scale beneath the map..
The 23rd was colder than the 22nd in south Jersey, but statewide not as cold. Kingwood fell to -5°, 15 stations from -1° to -4°, and 45 from 0° to 9°. Pequest and Sandyston reached -4° on the 24th, four stations from -1° to -3°, and 22 from 0° to 9°. The last subzero day was the 25th with Walpack -5°, five locations from -1° to -4°, and 22 from 0° to 9°. Sandyston hit 9° on the 26th and Walpack 8° on the 27th.
Table 2 lists the coldest temperature during the frigid outbreak at a NJWxNet station in any county that experienced subzero cold. Eleven of NJ’s 21 counties had a location register a subzero minimum, with two others having a station down to 0°. The six consecutive days with subzero lows at Walpack and Sandyston are rarely achieved at a New Jersey location. That said, these runs did not approach state records of 12 days at Newton (Sussex) in February 1979, 11 days at Layton (Sussex) in January 1961, and 10 days at both Sussex (Sussex) in January 1961 and in Culvers Lake from December 1917 into January 1981.
| County | Location | Minimum Temp. | Date |
|---|---|---|---|
| Atlantic | Mullica Township | -1° | 23rd |
| Bergen | Ramsey | -3° | 22nd |
| Burlington | Red Lion | -2° | 23rd |
| Cumberland | Vineland | -1° | 23rd |
| Gloucester | Piney Hollow | -2° | 23rd |
| Hunterdon | Kingwood | -10° | 22nd |
| Mercer | Hopewell Township | -9° | 22nd |
| Monmouth | Cream Ridge | 0° | 23rd |
| Morris | Chester Borough | 0° | 22nd |
| Passaic | Charlotteburg | -10° | 22nd |
| Somerset | Hillsborough-Duke | -9° | 22nd |
| Sussex | Walpack | -17° | 22nd |
| Warren | Pequest | -13° | 22nd |
Table 2. The coldest January minimums within the 13 counties with a NJWxNet station dropping to 0° or colder during January.
Oftentimes, due to a wavy jet stream configuration, when a cold outbreak impacts eastern North America, milder-than-normal conditions are found in Alaska. This was certainly the case between January 19th and 27th. The average temperature at Trenton Airport (Ewing Township, Mercer), hardly the coldest location in the state, was 21.2° during this nine-day period. This was 10.7° below normal. Meanwhile in central Alaska, Fairbanks averaged 23.4°, a remarkable 32.6° above normal. In other words, Fairbanks normally is 43.3° colder than Trenton Airport during this end-of-month interval while this year it was 2.2° milder. Mind you, earlier in the month Fairbanks had a day with a high of -28° and low of -38° (24° below normal), hardly New Jersey weather!
Precipitation and Storms
The storm in the hours before the arrival of 2025 deposited rain that counts in the January totals was discussed in the December report. Here, the monthly precipitation report will end with a discussion of the January 31st storm that finished early on February 1st, with this rainfall starting off the February count. Given this “trade off,” the greatest monthly precipitation at NJ Community Collaborative Rain, Hail, and Snow Network (CoCoRaHS) sites was 1.62” and 1.52” at two Lower Township (Cape May) sites. This was followed by Middle Township (Cape May) with 1.35”, Ventnor City (Atlantic) 1.34”, Ringwood (Passaic) 1.34”, Hopewell Township 1.29”, and Red Bank (Monmouth) 1.28”. On the low end, Pitman (Gloucester) saw just 0.55”, followed by Brick Township (Ocean) 0.59”, 0.60” at Hamilton (Mercer), Eatontown (Monmouth), and Long Branch (Monmouth), Franklin Township (Gloucester) 0.67”, and 0.68” at both Medford Lakes (Burlington) and Wenonah (Gloucester).
Monthly snowfall at CoCoRaHS stations was greatest at Mount Olive Township (Morris) with 10.0”, Sparta Township (Sussex) 9.7”, Lower Township 9.5”, Randolph Township (Morris) 9.2”, and Vernon Township (Sussex) 9.1”.
The first storm of the month brought moderate to heavy snow to far southern locations. On the 6th, four counties had totals exceeding 3.0” (Table 3). Of these, Cape May was hit hardest, with Wildwood Crest accumulating 8.0” and Lower Township 7.9”. Sixteen counties received at least an inch, with lower totals in the northeast (Figure 4). Melted snow totals were greatest in Lower Township with three reports of 0.89”, 0.80”, and 0.78”, Middle Township 0.77” and 0.75”, Dennis Township (Cape May) 0.59”, Woodbine 0.56”, Somers Point (Atlantic) 0.49” and 0.50”, and Millville (Cumberland) 0.49”.
| County | Location | Snowfall |
|---|---|---|
| Atlantic |
Somers Point Brigantine |
5.8” 5.1” |
| Cape May |
Wildwood Crest Lower Township |
8.0” 7.9” |
| Gloucester |
Glassboro Franklin Township |
3.1” 3.0” |
| Salem | Pittsgrove | 3.4” |
Table 3. The two county maximum snowfalls for the January 6th storm in three southern counties where at least one report exceeded 3.0” (only one 3”+ report from Salem County). Observations are from CoCoRaHS, NWS Cooperative Observer, and NWS Spotter reports.
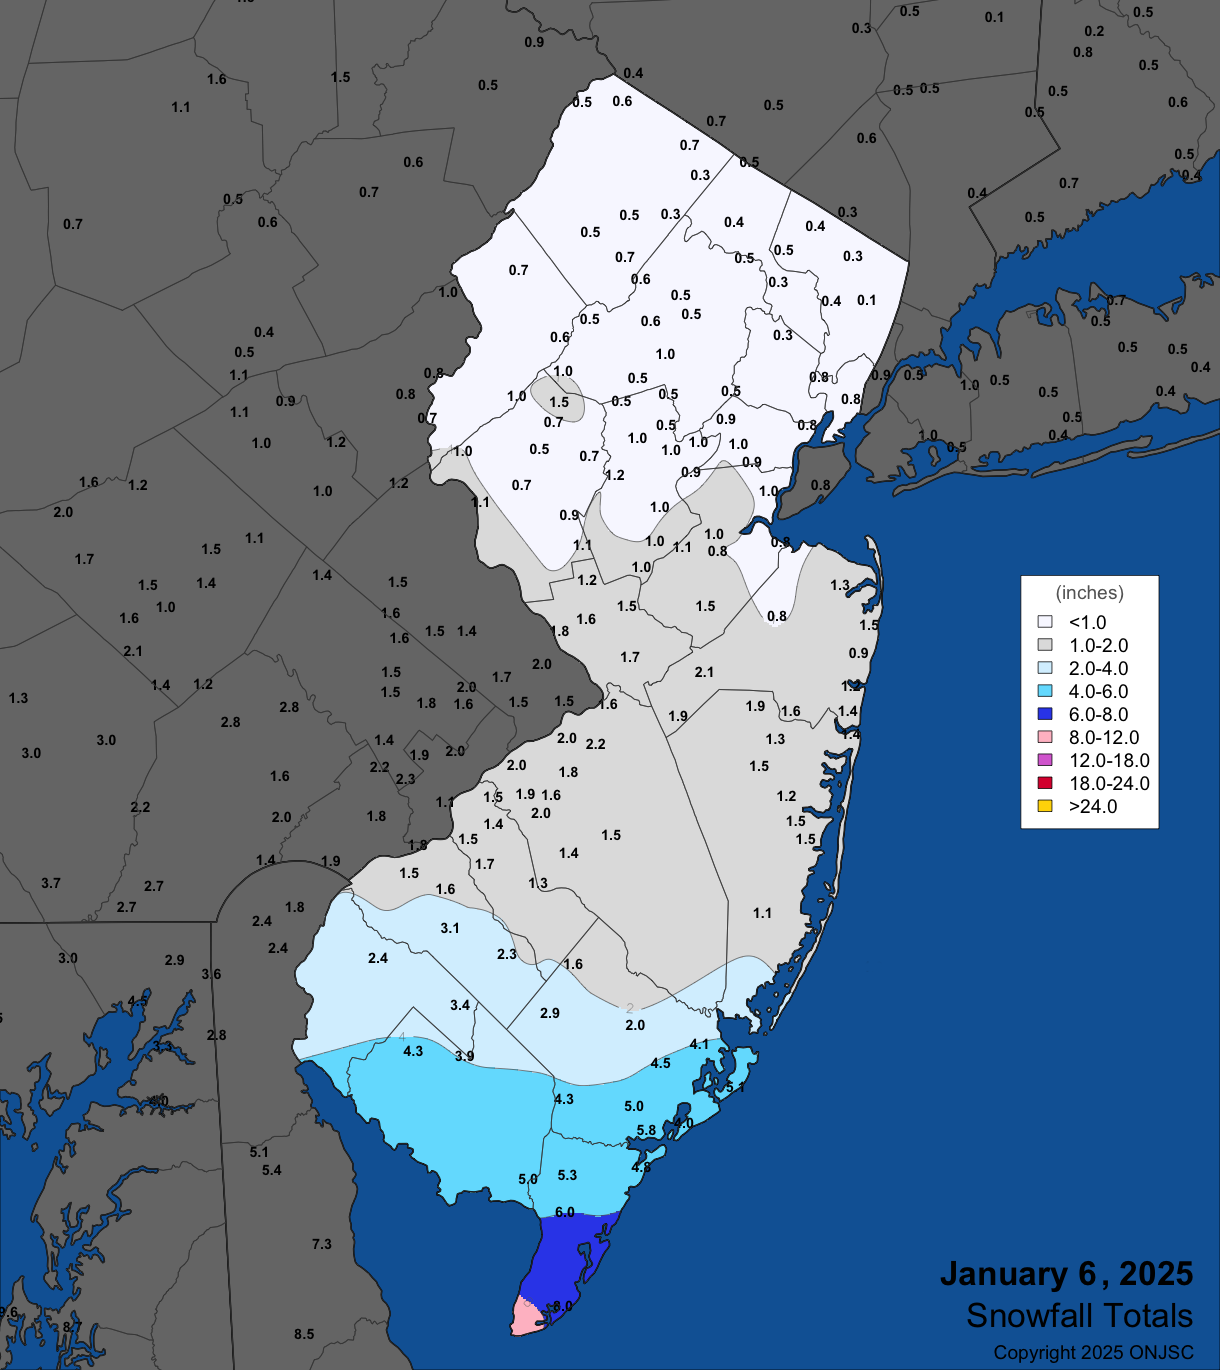
Figure 4. Snowfall on January 6th. Observations are from CoCoRaHS, NWS Cooperative Observer, and NWS Spotter reports.
Early snow on the 11th again favored the south, but no more than 2.2” fell in Rio Grande (Cape May) and 2.0” at both Cape May Court House and Middle Township. Twelve counties saw reports of at least 1.0”.
It was again light snow during the late afternoon and evening of the 16th, all totals remaining under 2.0”. Light rain and fog infiltrated the state on the 18th. Meager melted totals failed to exceed 0.12” at Hawthorne (Passaic) and 0.10” at Maurice River Township (Cumberland).
The 19th saw the largest most widespread snowfall of the month. While the far south received mostly light rain in the 0.10”–0.20” range, elsewhere, ten counties caught 4” or more of the white stuff and others (except Cape May) received at least an inch (Figure 5). The largest totals were in the far north, including 7.6” in Mount Olive Township (Morris) and 7.4” in Highland Lakes (Sussex; Table 4). The snow melted down to water equivalents of 0.53” at Ringwood, Mine Hill Township (Morris) 0.52”, and 0.51” in both West Milford Township (Passaic) and Vernon Township. On the 20th, snow covered the ground throughout New Jersey, as seen under clear skies by the NASA MODIS satellite (Figure 6).
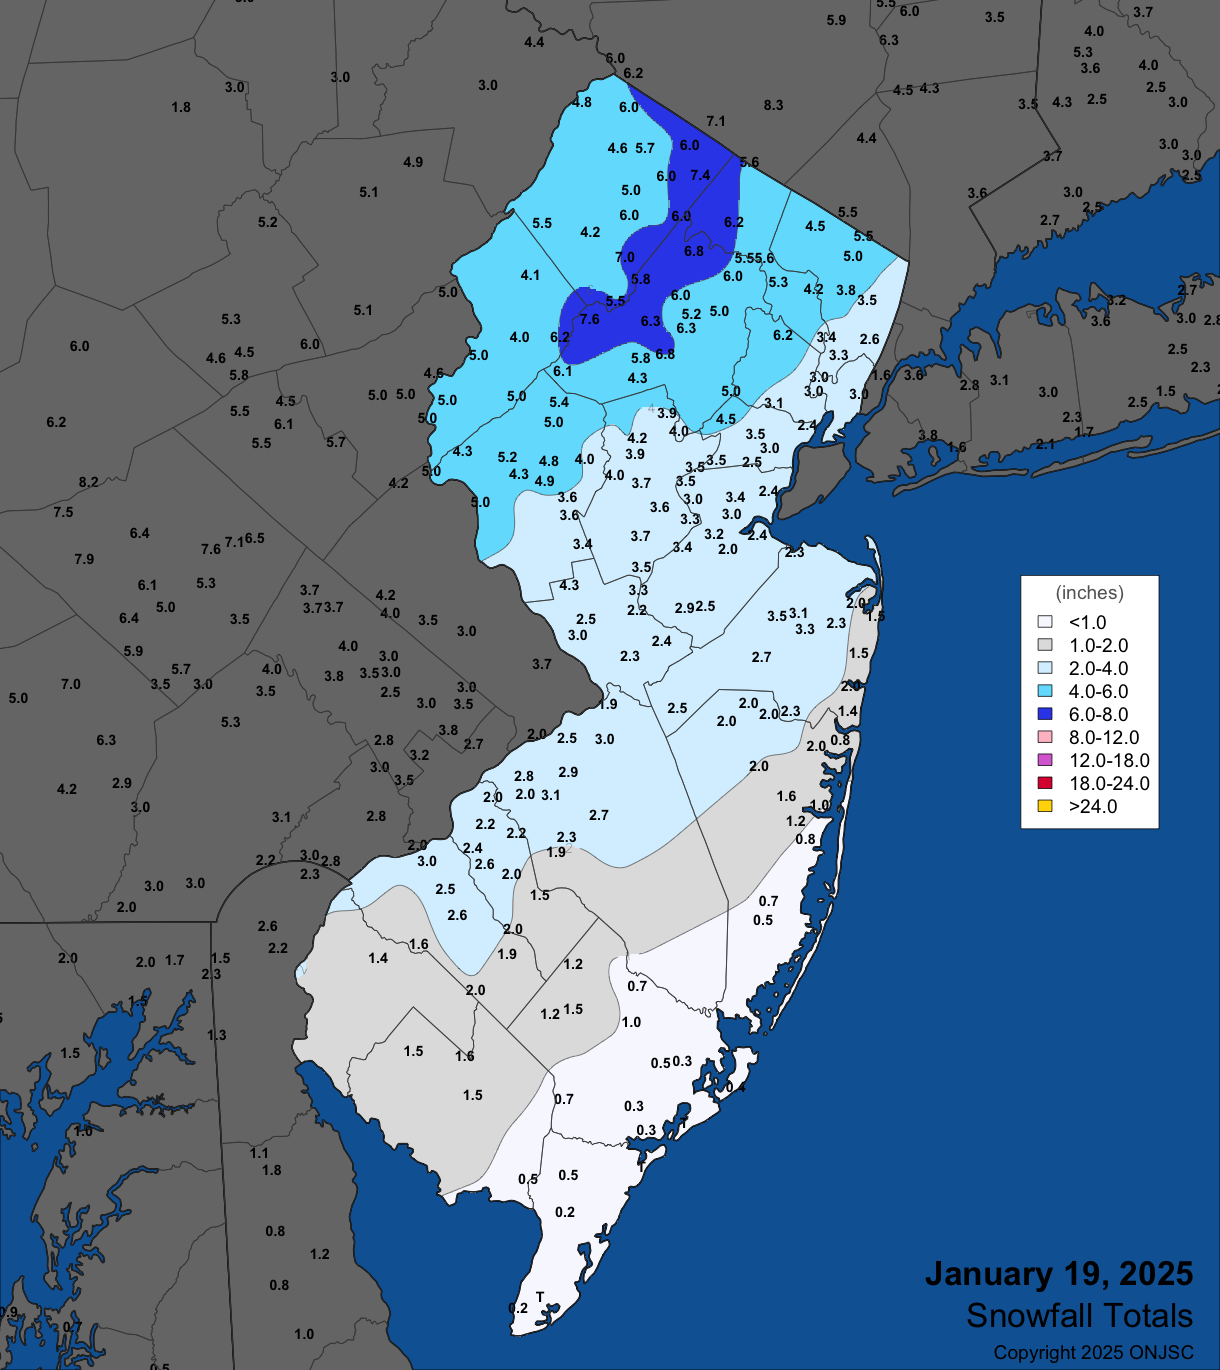
Figure 5. Snowfall on January 19th. Observations are from CoCoRaHS, NWS Cooperative Observer, and NWS Spotter reports.
| County | Location | Snowfall |
|---|---|---|
| Bergen | Montvale | 5.5” |
| Essex | Cedar Grove | 6.2” |
| Hunterdon | Califon | 5.4” |
| Mercer | Hopewell Township | 4.0” |
| Morris | Mount Olive Township | 7.6” |
| Passaic | West Milford Township | 6.2” |
| Somerset | Bedminster Township | 4.2” |
| Sussex | Highland Lakes | 7.4” |
| Union | New Providence | 4.5” |
| Warren | Hackettstown | 6.2” |
Table 4. Maximum snowfall for the 19th storm in counties where at least 4.0” fell. Observations are from CoCoRaHS, NWS Cooperative Observer, and NWS Spotter reports.
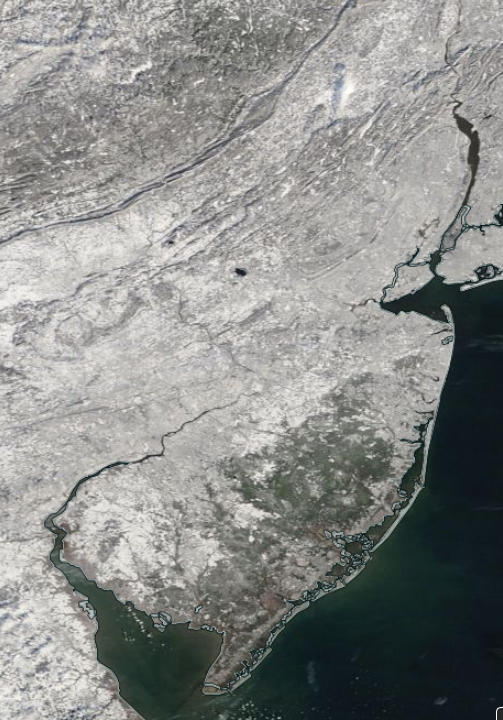
Figure 6. NASA MODIS visible satellite image on the morning of January 20th showing snow cover over New Jersey and surrounding states. The dark spot in west central NJ is unfrozen Round Valley Reservoir (Hunterdon) and the dark area in south Jersey is the Pinelands, where the coniferous trees “hide” the underlying snow cover from the satellite view. The far southeast had a thin cover, thus the tan hue in spots. NJ skies are cloud-free with a small area of clouds lying just north of Sussex County over Orange County, NY.
On the 31st, predawn light rain, including dangerous icing in northern locations, did not amount to more than 0.10” to 0.20”, and often less. More meaningful rain began under milder temperatures during the afternoon, continuing into the pre-dawn hours of February 1st. Totals from this event were greatest in the southern half of state, including Somers Point 0.81”, Hammonton (Atlantic) 0.85” and 0.80”, 0.81” at Buena Vista Township (Atlantic), Brigantine (Atlantic), and Woodbine, and 0.80” in Hamilton Township (Atlantic).
Wind, Dew Point, and Drought
Along with the limited precipitation during January, there were often low levels of humidity and winds that were quite strong. The latter two certainly contributed to chapping many lips, thus our theme of this month’s report. They also joined with the low precipitation to maintain or slightly increase drought ratings that in some areas had improved slightly with rather decent, yet still below normal, precipitation totals in late November and December.
It was an exceedingly windy January, not associated directly with a major storm passing through the state, rather resulting from NJ’s positioning between high- and low-pressure systems that zipped across North America. On 16 days, winds gusted to 40 mph or higher at NJWxNet stations, a record high number for the network. This included the first 11 days (and 12/31) to start things off. Seaside Heights (Ocean) gusted to 50 mph on the 1st, with 10 other stations from 40–49 mph. HPM, frequently among stations with the highest gusts, hit 44 mph on the 2nd. Fortescue (Cumberland) on the Delaware Bay coast reached 40 mph on the 3rd. Little Egg Harbor Township (Ocean) hit 50 mph on the 4th, with five other stations 40–45 mph. HPM topped out at 41 mph on the 5th and 46 mph on the 6th. A windy 7th saw HPM at 51 mph and nine others from 40–47 mph. HPM reached 50 mph, Sea Girt 47 mph, and three stations 43 mph on the 8th.
The 9th was the second windiest day of January, with Wantage (Sussex) up to 57 mph, HPM 56 mph, and 11 stations from 40–49 mph. When NJ is hit with strong winds, the atmosphere is, if you will, more homogenized. Thus, air temperatures tend to be quite uniform statewide, including inland, coastal, and urban locations. This was evident on the 9th when early morning low temperatures were rather uniform (Figure 7). It was just a few degrees colder at higher northwest locations, while most stations were within a degree or two of 20°
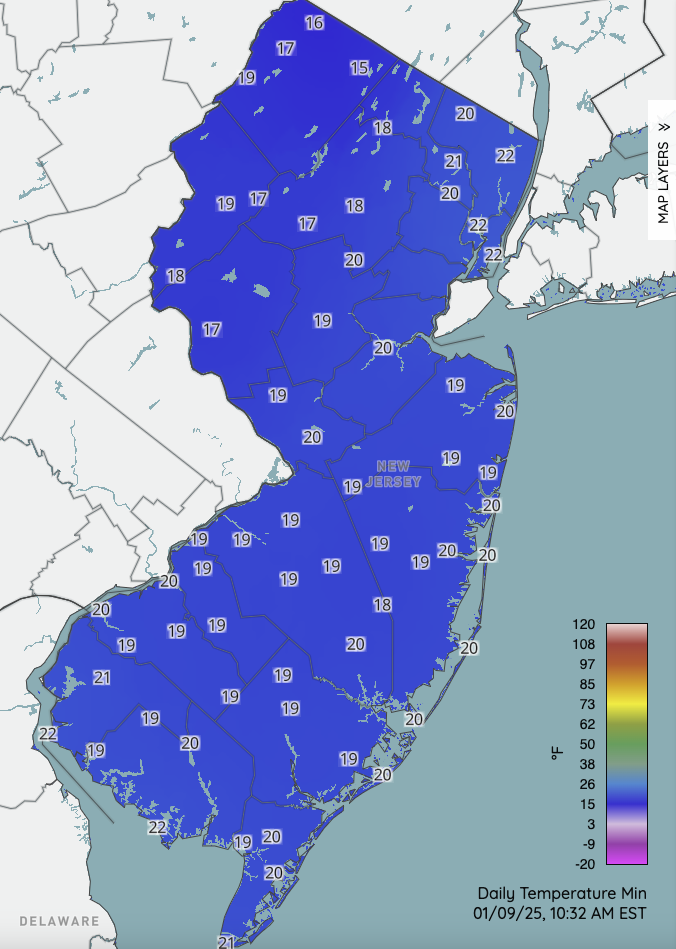
Figure 7. Minimum temperatures the morning of January 9th at Rutgers NJ Weather Network stations.
On the 10th, HPM reached 51 mph and Wantage 45 mph. Pennsauken (Camden) at 41 mph on the 11th ended the streak, only to return with a 41 mph gust on the 14th, followed by HPM at 40 mph on the 15th.
A less windy period ensued as bitter cold air settled in for a week, however, as conditions warmed late in the month, three windy days occurred. On the 28th, Sea Girt reached 43 mph. The winds howled on the 29th with Pennsauken up to 56 mph, HPM 52, Sea Girt 50 mph, nine stations from 45–49 mph, and ten from 40–44 mph (Figure 8). As conditions calmed, Seaside Heights still gusted to 45 mph and HPM 43 mph.
Over the course of January, the highest barometric pressure was observed on the 21st, ranging from 30.55”–30.65”. The 29th brought the lowest pressures, with a wide range from 29.35” in the north to 29.55” in the south.
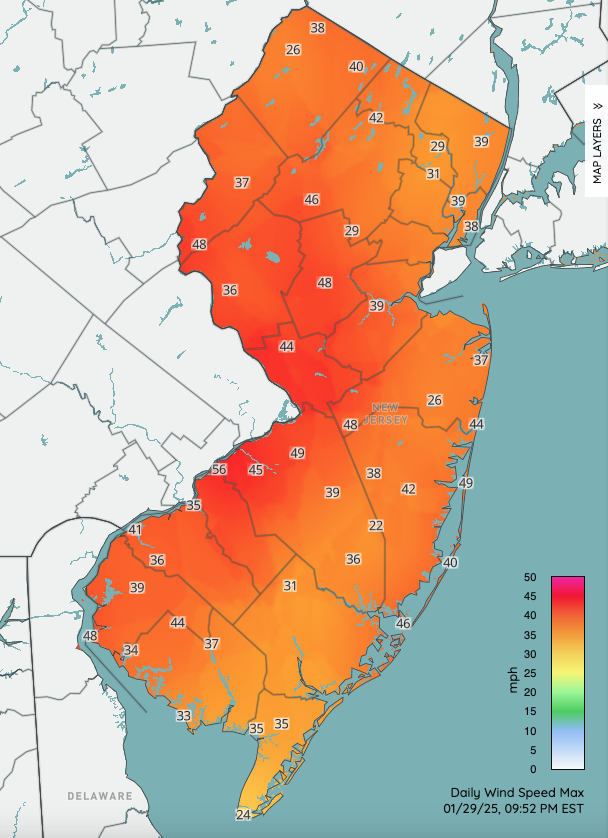
Figure 8. Peak wind gusts (mph) at NJWxNet stations on the morning of January 29th.
Turning to the dry air that frequently enveloped NJ during January, daily minimum dew point temperatures at NJWxNet stations were subzero on eight days at one or more location (8th, 20th –25th, and 27th). The lowest readings were at Walpack on the 21st at -21° and 22nd at -22°. Fifteen other days saw a station with a dew point between 0° and 9° (4th–7th, 9th–10th, 14th–17th, 19th, 26th, and 28th–30th).
Finally, a look at where NJ sat drought wise as January ended is in order. The state remains in a Drought Warning according to the NJ Department of Environmental Protection. The weekly US Drought Monitor map for the 28th had the south remaining in Extreme (D3) or Severe (D2) drought. D2 conditions are found in central NJ, while the north sits in Moderate drought (D1; Figure 9).
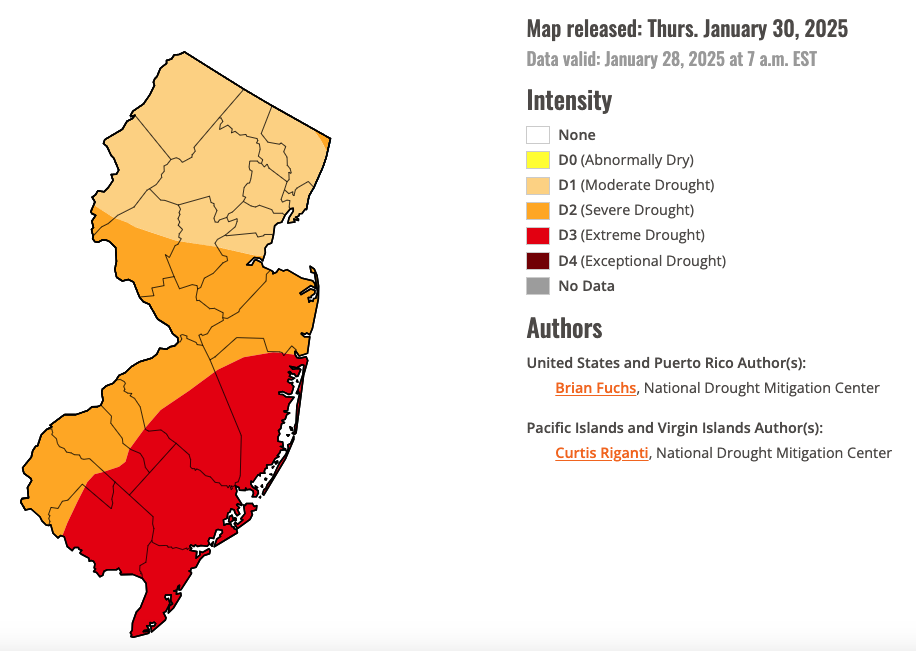
Figure 9. U.S. Drought Monitor map of conditions in NJ as of January 28, 2025.


