February Overview
Upon updating a weather friend regarding February conditions that transpired while they were away from the region, he remarked that most of what I reported appeared to have been more along the line of nuisances, while nothing of a blockbuster status occurred. I agreed, as while there were a few plowable events, one soaker (freezing rain at higher elevations), some cold and mild days, and (like in January) quite a few windy days, precipitation and temperatures came in close to normal and not much occurred that will leave lasting memories. In many respects, this applies to the entire winter of 2024/2025 (December–February), leaving an impression among many that this season had a wintrier feel than recent years. However, it was without a major nor’easter, be one excessively wet or white. Meanwhile, when all was said and done, a statewide drought warning remained in place. This report examines February conditions followed by a winter recap.
Statewide, February precipitation (rain and melted snow) averaged 2.53”. This is 0.33” below the 1991–2020 normal and ranks 50th driest since 1895. The precipitation was quite evenly distributed across the state, although the northwest came in on the drier side (Figure 1). The northern climate division averaged 2.56” (-0.23”, 58th driest), the southern division 2.50” (-0.39, 46th driest), and the coastal division 2.59” (-0.48”, 51st driest).
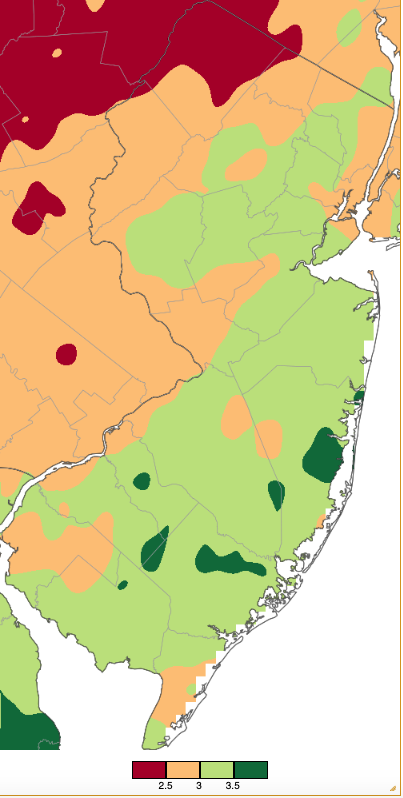
Figure 1. February 2025 precipitation across New Jersey based on a PRISM (Oregon State University) analysis generated using NWS Cooperative, CoCoRaHS, NJWxNet, and other professional weather station observations from 7 AM on January 31st to 7 AM on February 28th. Note the scale in inches at the bottom of the map. Totals range from 2.00”–2.49” (dark red) to 3.50”–3.99” (dark green).
February snowfall averaged 5.4” across NJ. This was 2.8” below the 1991–2020 normal, ranking as the 64th least snowy since 1895. The northern snow region averaged 5.9” (-4.4”, 52nd least snow), the central region 4.6” (-4.5”, 50th least snowy), and the southern region 5.6” (-1.1”, 78th least snowy/54th snowiest).
The average statewide temperature for February was 33.6°. This was 0.3° below normal and ranked as the 42nd mildest (90th coldest) of the past 131 Februarys. The average maximum of 41.9° was 1.2° below normal, ranking 48th mildest, and the average low of 25.3° was 0.7° above normal, ranking 34th mildest. The north averaged 30.6° (-0.7°, 45th mildest), south 35.4° (-0.1°, 40th mildest), and coast 36.0° (0.0°, 37th mildest).
Precipitation and Storms
An examination of several hundred Community Collaborative Rain, Hail, and Snow Network (CoCoRaHS) stations found that Galloway Township (Atlantic County) with 3.94” collected the most rain and melted snow during the month. This was followed by Cranford Township (Union) 3.76”, Point Pleasant Beach (Ocean) 3.73”, Hammonton (Atlantic) 3.65”, and Winslow Township (Camden) 3.62”. Driest locations included Sparta Township (Sussex) 2.28”, Franklin (Sussex) 2.32”, Mount Olive Township (Morris) 2.43”, Greenwich Township (Warren) 2.48”, and Hackettstown (Warren) 2.56”. The most snowfall at locations with complete daily observations occurred at Califon (Hunterdon) with 8.4”, followed by Galloway Township and Somers Point (Atlantic) each with 8.1”, two Lower Township (Cape May) stations at 8.0”, and Woodbine (Cape May) 7.9”. There were a number of locations that received less than 4.0”.
The first rainfall event to be included in February totals was one falling from late afternoon on January 31st into the predawn hours of February 1st. As explained just a month ago, when evening rain on December 31st was included in January totals, this inclusion of last day of the month precipitation in the following month’s total is due to the common morning observation time at most stations. This was a south Jersey rain for the most part with Woodbine catching 0.94”, followed by Winslow Township at 0.90”, Somers Point (Atlantic) 0.87”, and Hammonton 0.85” and 0.80” (Figure 2). Seventy one of the 218 CoCoRaHS reports were from 0.50”–0.80”. Totals were under 0.20” in most of the northern half of NJ. Winds during the storm gusted to 40 mph at both High Point Monument (HPM; Sussex) and Pennsauken (Camden).
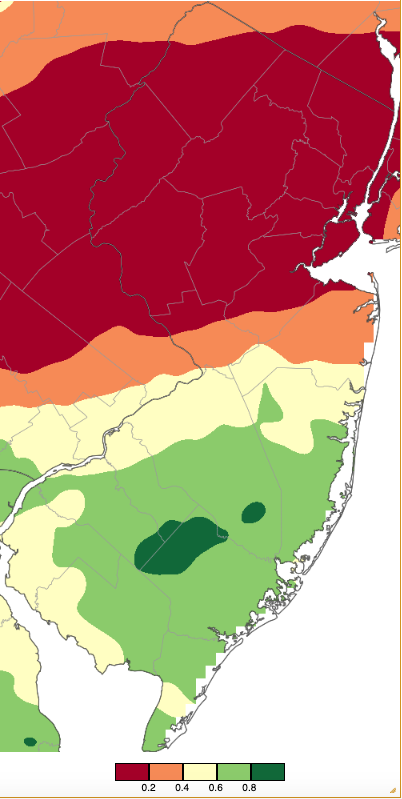
Figure 2. Precipitation across New Jersey from 7 AM on January 31st through 7 AM February 1st based on a PRISM (Oregon State University) analysis generated using NWS Cooperative, CoCoRaHS, NJWxNet, and other professional weather station observations. Note the scale in inches beneath the map.
The afternoon and evening of the 2nd saw freezing drizzle and light snow in central and northern areas. Mount Olive Township received the most snow at 1.7”, with Butler (Morris), Denville Township (Morris), and Newton (Sussex) coming in with 1.5”. Top liquid totals included just 0.19” in Far Hills (Somerset) and 0.17” in both Montvale (Bergen) and Long Hill Township (Morris).
At its onset, the 6th saw mixed precipitation in northern and central regions and rain in the south, later transitioning to rain everywhere. Precipitation totals were quite consistent across NJ, topping out at 0.57” in Bedminster Township (Somerset), Upper Deerfield Township (Cumberland) 0.53”, both Millville (Cumberland) and Denville Township 0.52”, and 189 CoCoRaHS stations from 0.25”–0.51”. One inch of snow fell in Lebanon (Hunterdon), Sparta Township, and Vernon Township (Sussex). As the storm departed on the 7th, winds gusted to 48 mph at HPM, 47 at Wantage (Sussex), and 40–41 mph at two other NJWxNet locations.
Another mixed bag of precipitation fell across the state from the later afternoon of the 8th, ending before dawn on the 9th. Snow that eventually went to sleet in most areas accumulated in the north, central areas had abundant sleet followed by some freezing drizzle, and the south received rain, some of it freezing in inland areas. Of 225 reports, North Arlington (Bergen) saw the most liquid and melted precipitation at 0.83”, followed by Woodbridge Township (Middlesex) 0.79” and 0.75”, Wood-Ridge (Bergen) 0.77”, and Point Pleasant Beach 0.74” (Figure 3). From 0.50”–0.73” fell at 126 locations.
Snowfall and sleet for the 8th–9th event totaled 2.0” or greater in eight counties, topped by 4.4” in Highland Lakes (Sussex; Figure 4, Table 1).
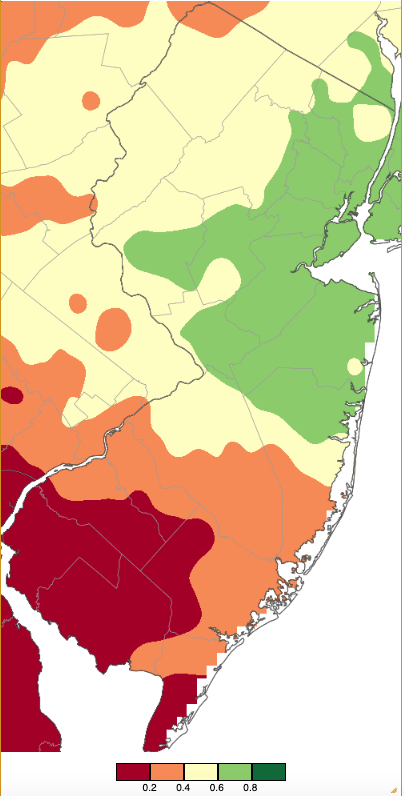
Figure 3. Precipitation across New Jersey from 7 AM on February 8th through 7 AM February 9th based on a PRISM (Oregon State University) analysis generated using NWS Cooperative, CoCoRaHS, NJWxNet, and other professional weather station observations. Note the scale in inches beneath the map is the same as in Figure 2.
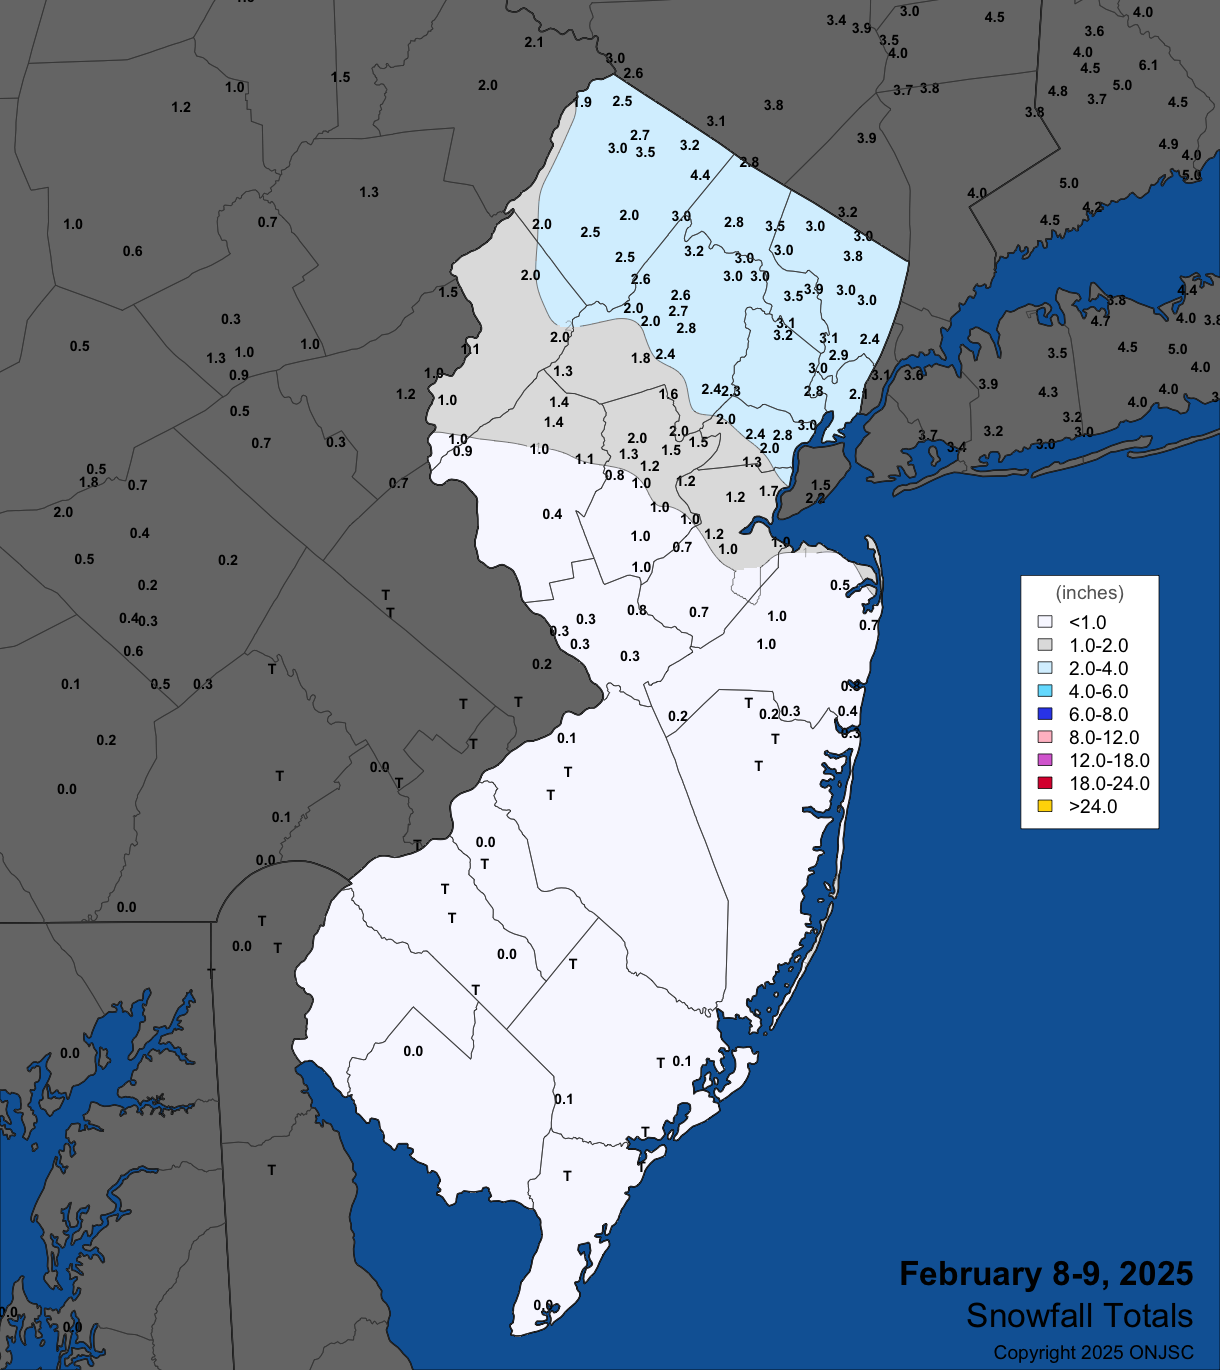
Figure 4. Snowfall on February 8th–9th. Observations are from CoCoRaHS, NWS Cooperative Observer, NWS spotters, and reports from the North Jersey Weather Observers.
| County | Location | Snowfall |
|---|---|---|
| Bergen | Hillsdale | 3.8” |
| Essex | Cedar Grove | 3.2” |
| Hudson | Harrison | 2.8” | Morris | Butler | 3.2” |
| Passaic | Hawthorne | 3.9” |
| Somerset | Bedminster Township | 2.0” |
| Sussex | Highland Lakes | 4.4” |
| Warren | Frelinghuysen Township & Hackettstown | 2.0” |
Table 1. Maximum snowfall for the February 8th–9th storm in all NJ counties where at least one location reported 2.0” or more. Observations are from CoCoRaHS, NWS Cooperative Observer, NWS spotters, and reports from the North Jersey Weather Observers.
For the second time in a little over a month, south Jersey was the snow champion of the state, with Cape May (Cape May) topping out with 8.8” and Lower Township 8.1”. Atlantic County followed with 8.1” in Somers Point and 8.0” at Galloway Township. Thirteen counties saw at least one station record 2.0” or more (Figure 5, Table 2). This all-snow event melted down to as much as 1.01” in Brigantine (Atlantic), Lower Township 0.87”–0.80” (three locations), Galloway Township 0.86” and 0.82”, Ventnor City (Atlantic) 0.85”, and Middle Township (Cape May) 0.84” and 0.81”. Of 231 CoCoRaHS reports, 38 came in with 0.50”–0.78” of melted snow.
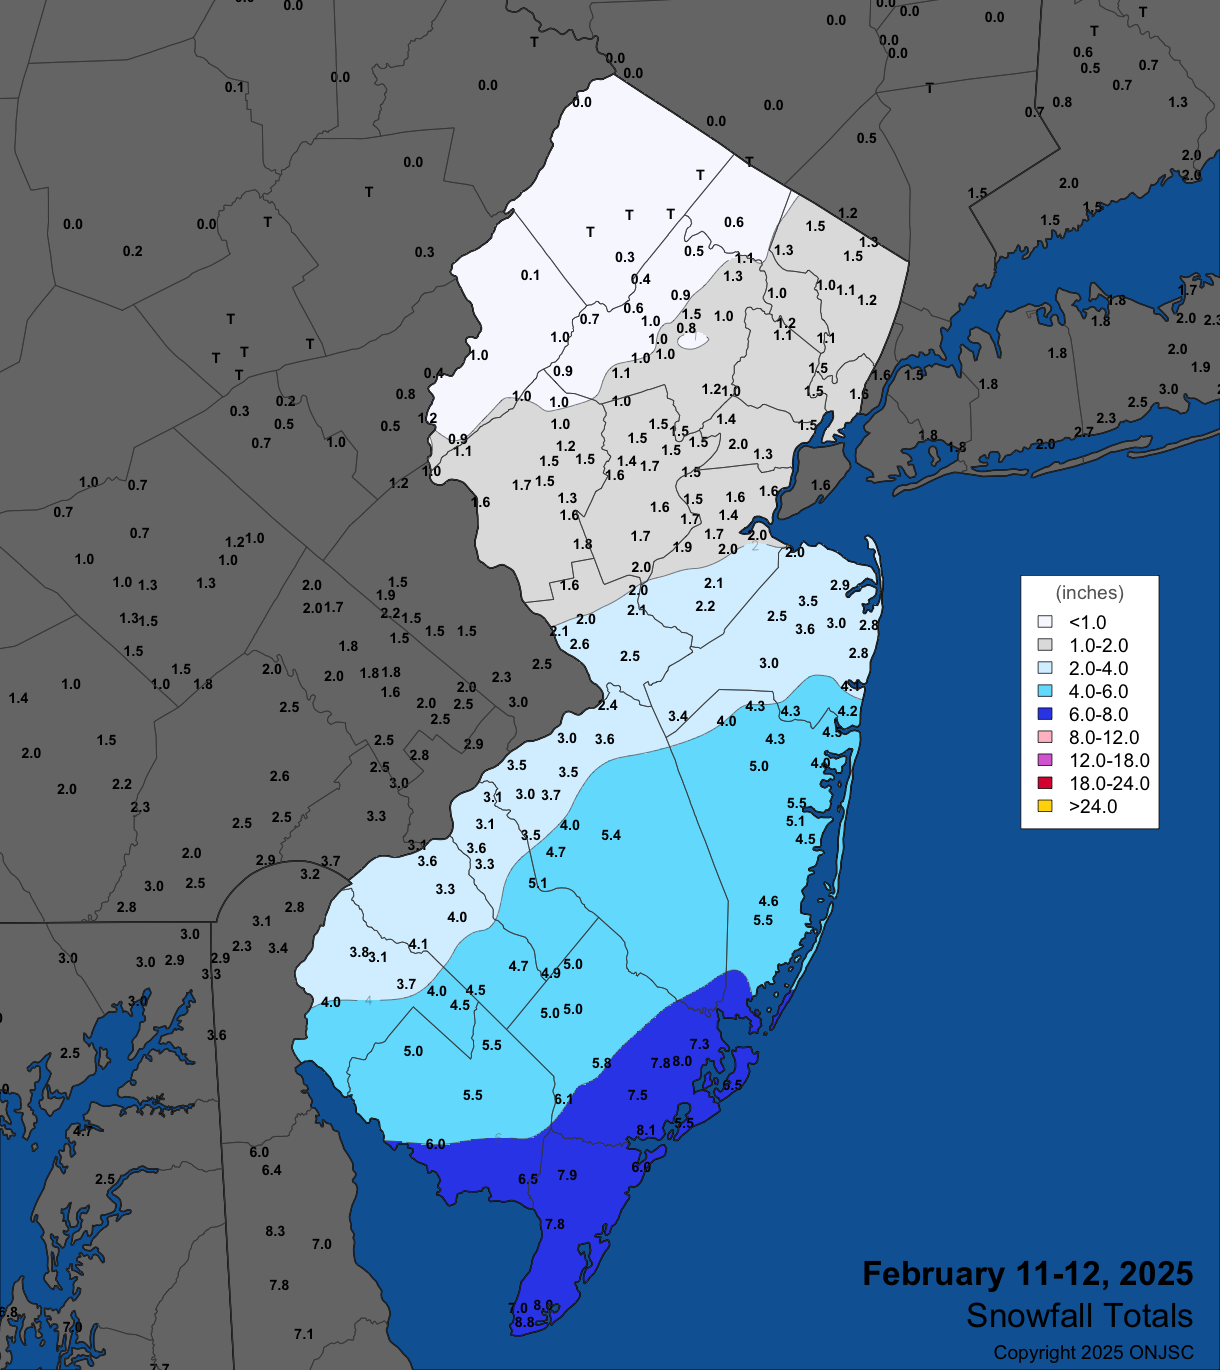
Figure 5. Snowfall on February 11th–12th. Observations are from CoCoRaHS, NWS Cooperative Observer, NWS spotters, and reports from the North Jersey Weather Observers.
| County | Location | Snowfall |
|---|---|---|
| Atlantic | Somers Point | 8.1” |
| Burlington | Southampton Township | 5.4” |
| Camden | Winslow Township | 4.9” | Cape May | Cape May | 8.8” |
| Cumberland | Maurice River Township | 6.5” |
| Gloucester | Monroe Township | 4.7” |
| Mercer | Ewing Township | 2.6” |
| Middlesex | Monroe Township | 2.2” |
| Monmouth | Howell Township | 4.3” |
| Ocean | Stafford Township & Toms River Township | 5.5” |
| Salem | Pittsgrove Township | 4.5” |
| Somerset | Franklin Township | 2.0” |
| Union | Westfield | 2.0” |
Table 2. Maximum snowfall for the February 11th–12th storm in all NJ counties where at least one location reported 2.0” or more. Observations are from CoCoRaHS, NWS Cooperative Observer, NWS spotters, and reports from the North Jersey Weather Observers.
Conditions warmed quickly and rain fell from late on the 12th into the morning of the 13th, heaviest in some of the areas that had just received the most snow. This combination quickly melted most of the short-lived snow cover. Rainfall totals included Maurice River Township (Cumberland) with 0.75”, Galloway Township 0.56” and 0.50”, and Brick Township (Ocean) 0.53”. Some 104 locations caught 0.25”–0.50”. Minor amounts of snow fell to the north with Clinton Township (Hunterdon) catching 1.0” and Califon 0.8”. Wind accompanying the storm rose in gusts to 52 mph at HPM and Pennsauken, 49 mph in Lower Alloways Creek Township, and 40–47 mph at 11 other NJWxNet stations.
The most productive precipitation event of the month commenced on the afternoon of the 15th with a few bursts of snow in northern and central regions. Early snowfall amounted to as much as 1.8” in Holland Township (Hunterdon), followed by Clinton Township (Hunterdon), Bedminster Township (Somerset), and Bridgewater Township (Somerset) each with 1.5”, and Califon 1.4”. By evening, it became an all-rain event throughout NJ, though temperatures remained below freezing for a time in the north. In fact, they remained below freezing throughout the entire event at higher elevations in the northwest where ice accumulated to over 0.5” (Figure 6). This ice storm did considerable tree damage (Figure 7).
Precipitation totals for the event were as high as 1.99” and 1.92” in Bernards Township (Somerset), Branchburg Township (Somerset) 1.97”, Cranford Township 1.85”, Readington Township (Hunterdon) 1.79”, Bridgewater Township 1.76”, and 1.72” in both Glen Rock (Bergen) and Madison (Morris; Figure 8).
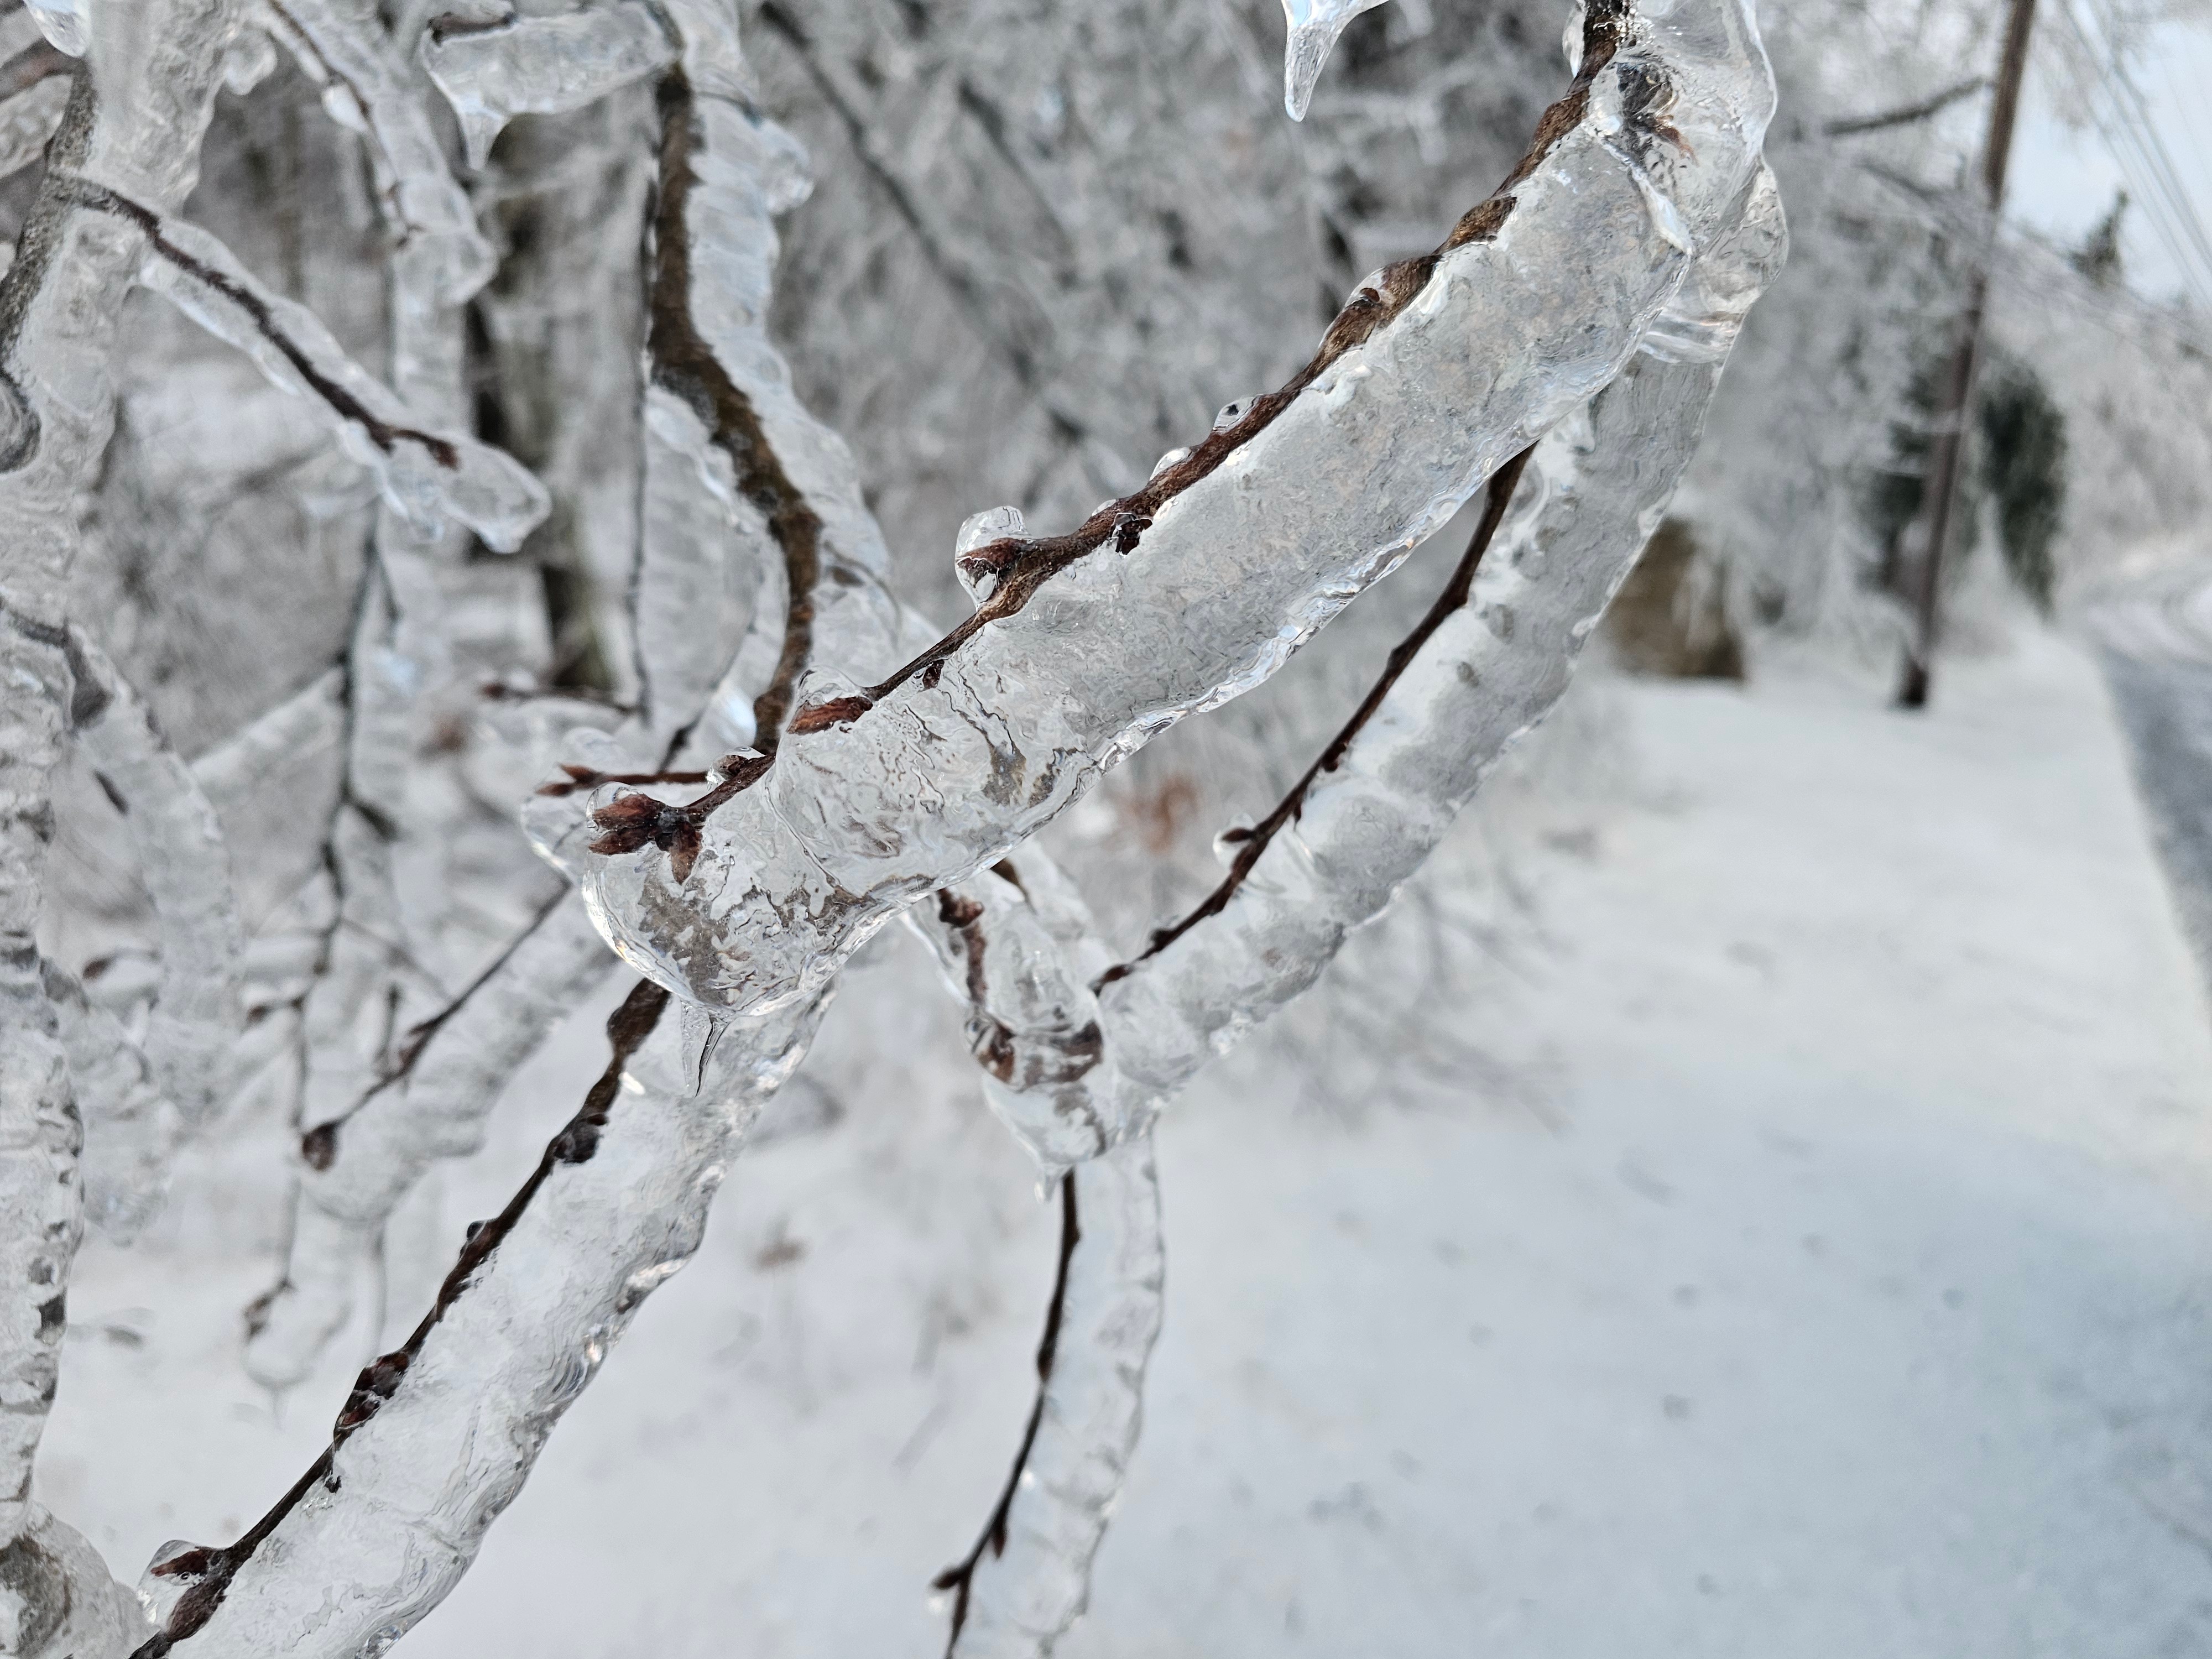
Figure 6. Freezing rain on trees at High Point State Park on the morning of the 17th (courtesy of N. Stefano).
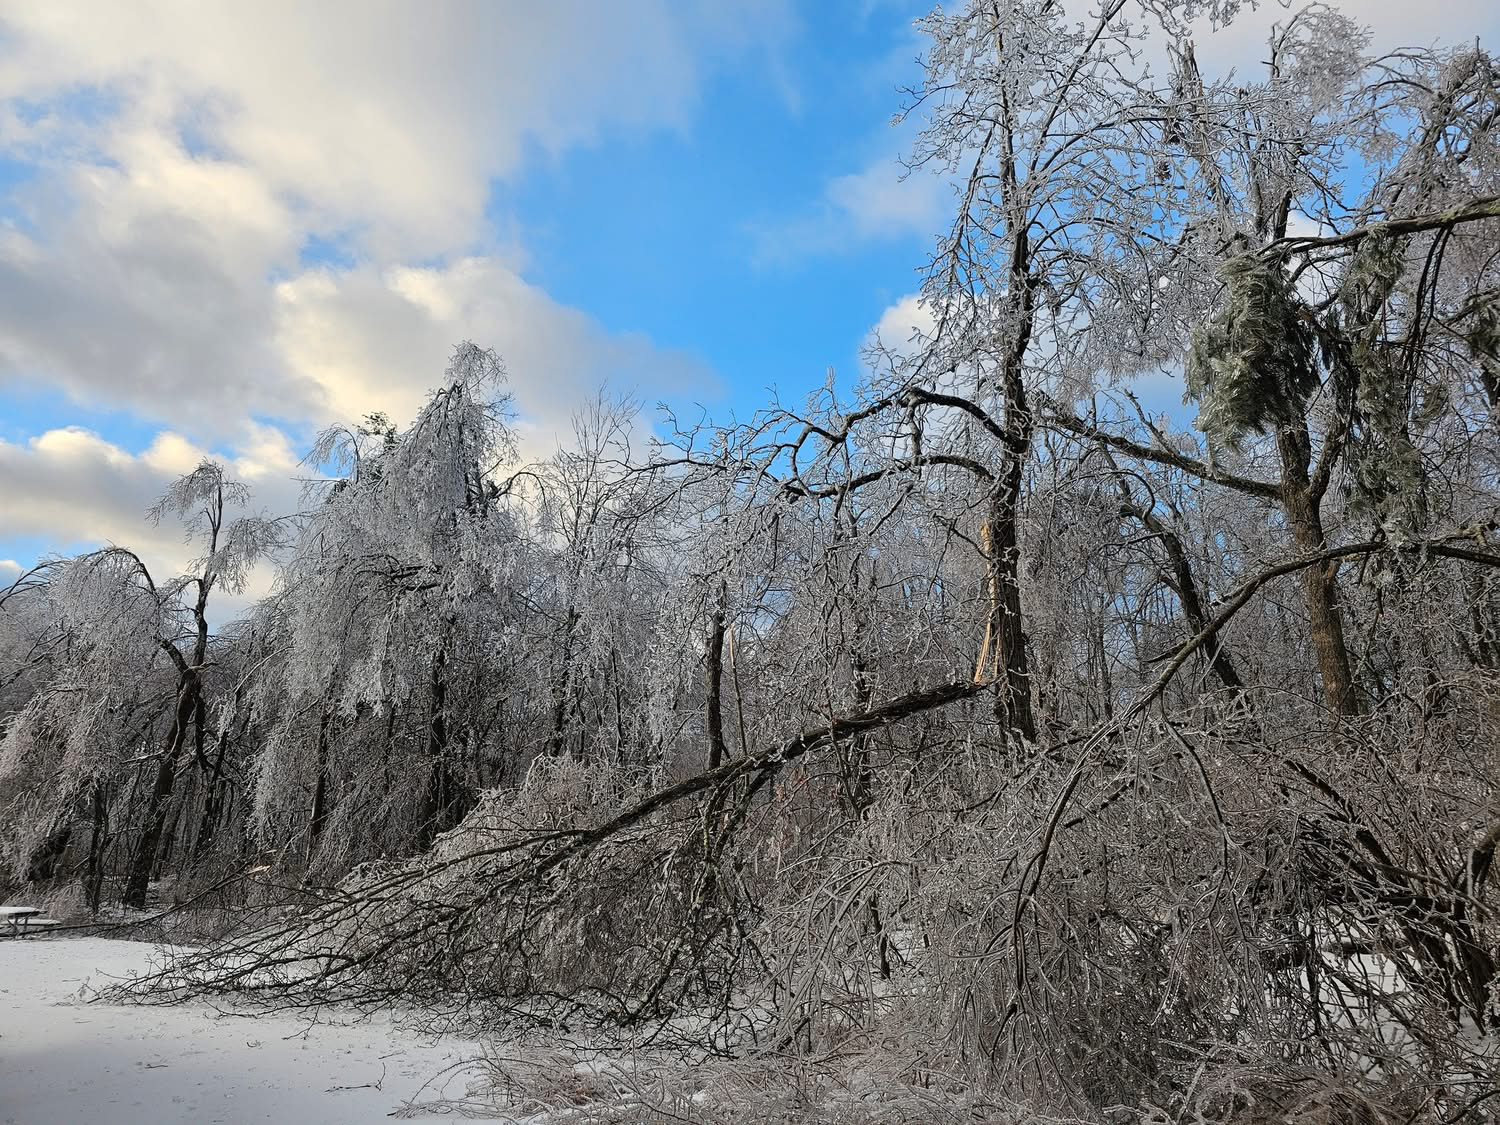
Figure 7. Freezing rain-induced tree damage at High Point State Park on the morning of the 17th (courtesy of N. Stefano).
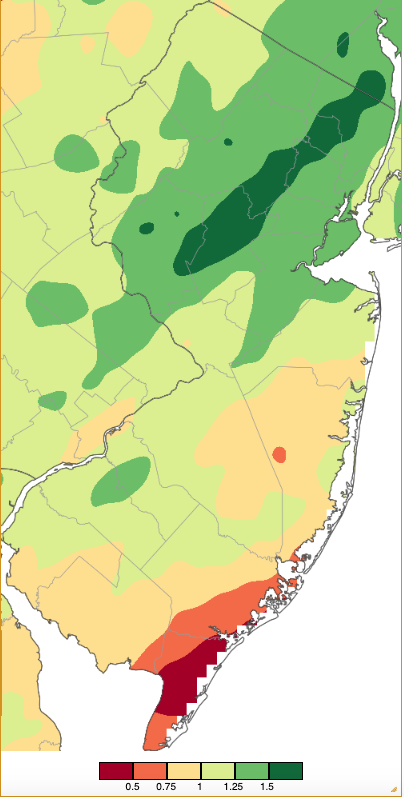
Figure 8. Precipitation across New Jersey from 7 AM on February 15th through 7 AM February 17th based on a PRISM (Oregon State University) analysis generated using NWS Cooperative, CoCoRaHS, NJWxNet, and other professional weather station observations. Note the scale in this figure differs from Figures 2 and 3.
As the rain departed the morning of the 16th, surface air temperatures across the south rose into the 60°s while being no higher than the 30°s in central and northern areas. As seen in Figure 9, by late morning this thermal gradient ran from 60° at Piney Hollow (Gloucester) to 30° at the High Point station alongside Route 23 (the HPM station, not shown, sat at 27°). Meanwhile, the northwest hills remained encased in ice, not to melt fully for the next week. An impressive thermal inversion developed in central NJ, with the temperature rising from the mid 30°s near the surface to the mid 50°s between 2,500 and 3,000 feet during the morning and from the low 40°s to about 60° by early afternoon (Figure 10). The New Brunswick (Middlesex) surface air temperature peaked at 47° as a cold front swept into the region in the early evening.
With the arrival of the front, barometric pressure bottomed out close to 29.00” across NJ. Accompanying and behind the front, winds howled throughout the state (Figure 11). Gusts rose to 71 mph at Pennsauken, Lower Alloways Creek Township 68 mph, Atlantic City Marina (Atlantic) 64 mph, Sea Girt (Monmouth) 63 mph, Seaside Heights (Ocean) 62 mph, Berkeley Township (Ocean) 61 mph, and Moorestown (Burlington) 60 mph. Eight other NJWxNet stations gusted from 50–56 mph, 12 from 45–49 mph, and 12 from 40–44 mph. Northern areas were not quite as windy, in part due to more trees sheltering some anemometers, frozen anemometers not reporting at higher elevations, including frequently windy HPM (locked in ice from 15th–20th), and a broken anemometer at the Vernon Township station situated atop a ski lift at the Mountain Creek ski area.
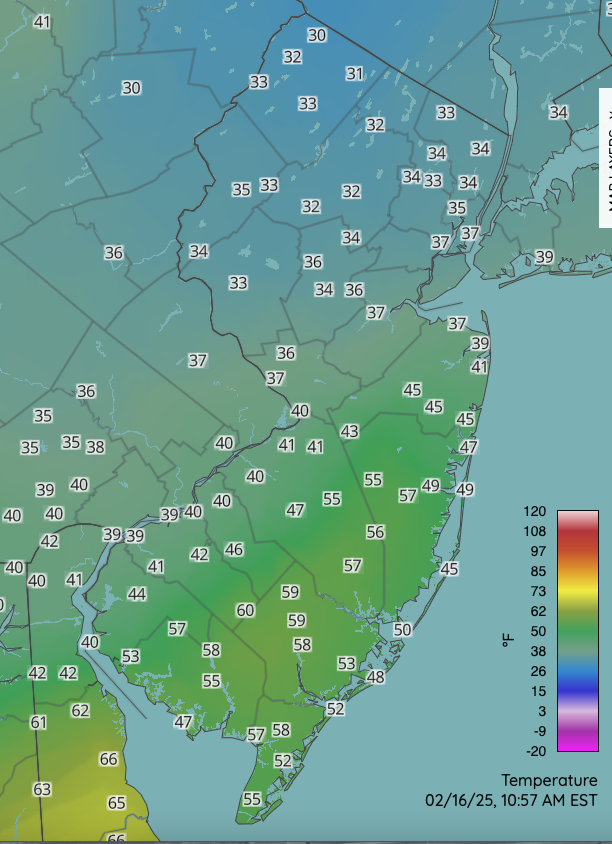
Figure 9. Surface air temperatures at 10:57 AM on February 16th. Map includes observations from NJWxNet, Delaware Environmental Observing System, and National Weather Service stations.
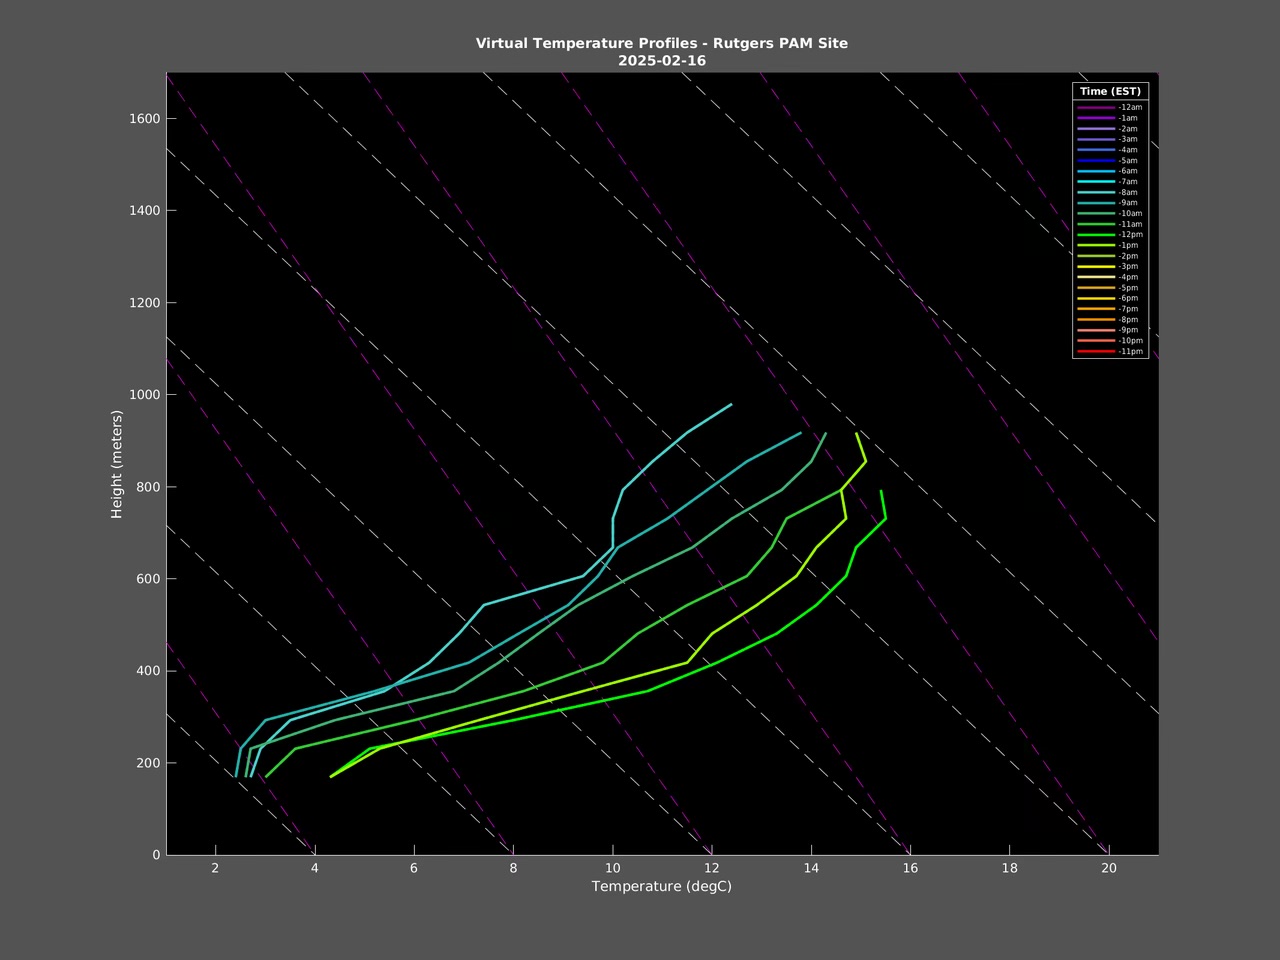
Figure 10. Vertical temperature profile of the lowest 800 to 900 meters (approximately 2,600–2,900 feet) of the atmosphere at the Rutgers PAM site in East Brunswick from 8 AM (blue lines on left) to 1 PM (lime green line second from the right) on February 16th. The left axis is altitude (meters) and the bottom axis is temperature (°C).
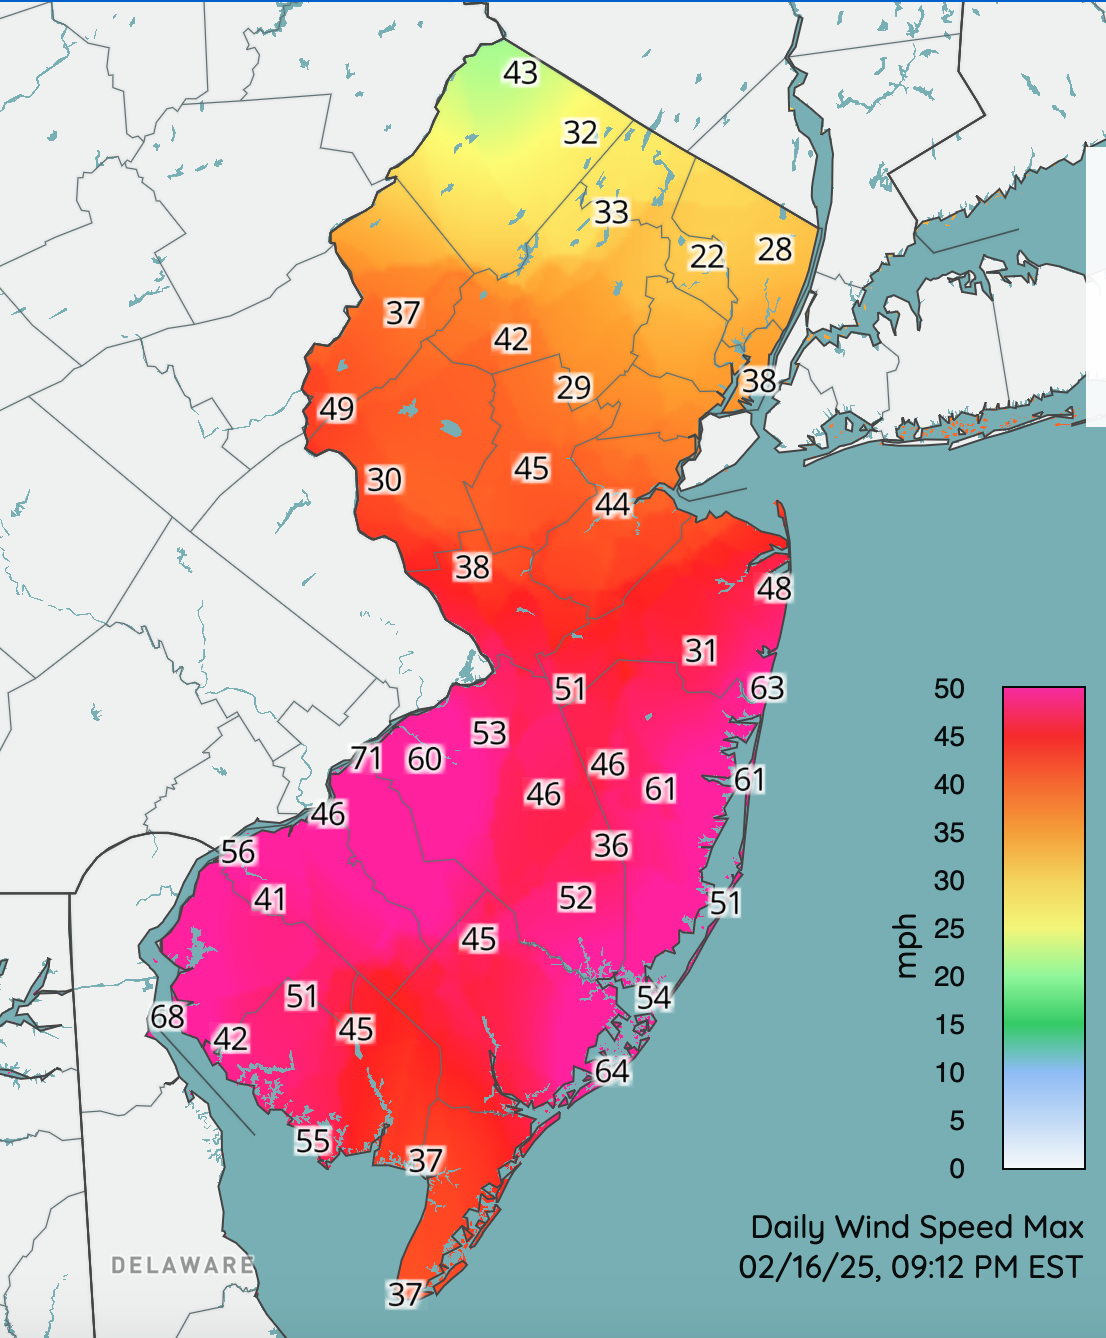
Figure 11. Daily wind speed maximums in mph at NJWxNet stations on February 16th. Maximums had been achieved by the time the map was generated at 9:12 PM.
The rapid onset of winds on the 16th at the time the unusually low pressure began an upward climb is seen at the Hillsborough-Duke (Somerset) NJWxNet station (Figure 12). The wind and pressure time series in this figure includes two episodes of rapid windy onsets following the passage of low pressure. The event on the 13th included gusts of 52 mph at HPM and Pennsauken, 49 mph at Lower Alloways Creek Township, and 40–47 mph at eleven other NJWxNet stations. The decline in pressure on the 15th saw gusts of 51 mph in Woodbine, 50 mph at Pennsauken, and 40–49 mph at 29 other NJWxNet stations. Gusts on the 16th have already been mentioned with those winds not ceasing until the 17th brought gusts of 54 mph to Little Egg Harbor Township (Ocean) and Lower Alloways Creek Township, 50–52 mph gust at four stations, and 40–49 mph at 26 additional NJWxNet stations.
Winds were mainly from the west during the prolonged episode from the 16th into the 18th. This resulted in a blowout tide in the back bays along the coast. As seen in tidal gage records from Barnegat Bay (Ocean; Figure 13), water levels were exceedingly low over four consecutive low tides, barely rising to more common low tide levels at the times of high tide. As a result, some docks were fully exposed, and some boats were mired on the muddy substrate.
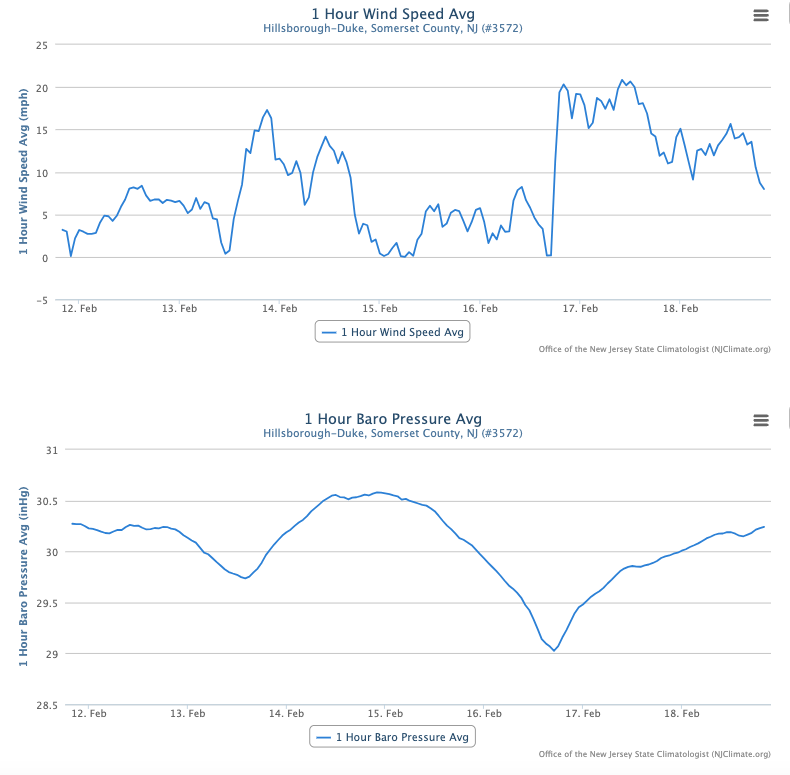
Figure 12. Hourly average wind speeds (mph; top) and barometric pressure (inHg) from February 12th through February 18th at the Hillsborough-Duke (Somerset) Rutgers NJWxNet station. For reference, the rapid increase in speed on the 16th occurred shortly before 6 PM, with the minimum pressure achieved approximately an hour earlier.
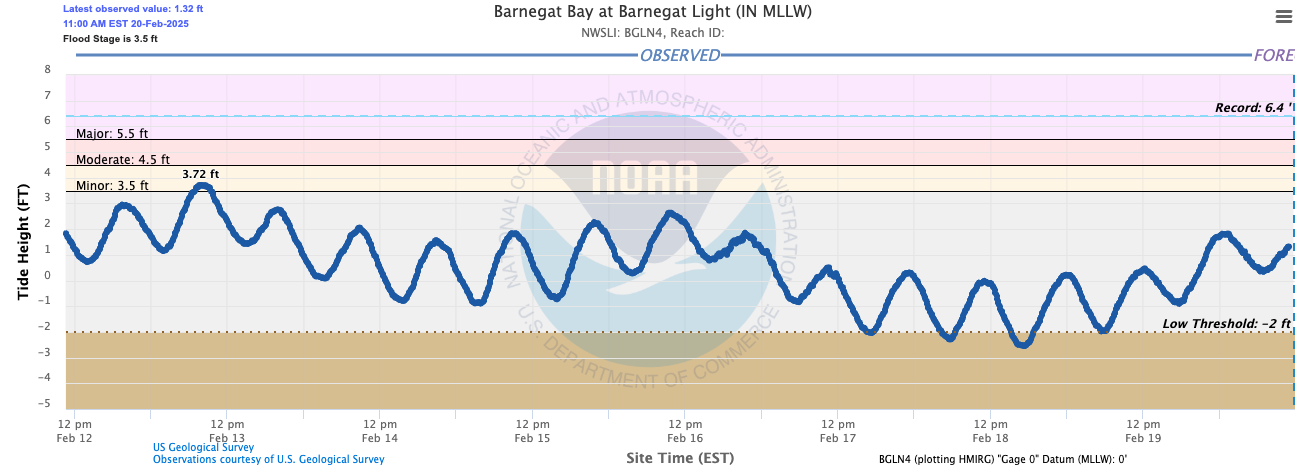
Figure 13. Tidal fluctuations (blue line) from 12 PM February 12th to 12 PM February 20th at the Barnegat Bay gage at Barnegat Light (Ocean).
Following the active mid-month period, the remainder of February generally saw milder conditions and minimal precipitation. The only episode worth mentioning included afternoon snow showers throughout the state on the afternoon of the 20th. Accumulations of an inch or more were found in west central spots including Califon 1.9”, Mansfield Township (Warren) 1.2”, and 1.0” at both Clinton Township and Belvidere (Warren). This event included winds gusting to 43 mph at Wantage and 40 mph in Fortescue (Cumberland). Gusty winds continued into the 21st, with a 46 mph gust at Wantage and 40–44 mph gusts at three other locations, and a gust to 44 mph at HPM on the 22nd.
Of the ten February days with gusts within the NJWxNet of 40 mph or higher, the only one not mentioned previously were the gusts to 45 mph at Pennsauken, 41 mph at both Upper Deerfield (Cumberland) and HPM, and 40 mph at three other locations on the 4th. The highest barometric pressures of the month were 30.55”–30.60” on both the 2nd and 14th. Lowest pressures were 29.00”–29.10” on the 16th.
Temperature
There were nine February days when one of more NJWxNet station recorded a high temperature of 55° or higher and twelve with 15° or lower minimums. There was not a day when all 69 NJWxNet stations remained below freezing, while on 14 days, all rose above freezing. There also was not a day when at least one location failed to drop below freezing, while on 14 days all fell below freezing. On the 1st, 20th, and 22nd every station had a subfreezing minimum and an above freezing maximum.
Looking first at ≥55° maximums, the 1st found Cape May Court House (Cape May) at 56° and Woodbine 55°. HPM only reached 35°. Fort Dix (Burlington) rose to 59° on the 3rd, with 16 stations from 55°–58°. As three days earlier, the 4th saw Cape May Court House at 56° and Woodbine 55°. The first 60° day of the year arrived on the 16th when Vineland (Cumberland) hit 64°, 26 stations 60°–63°, and 12 from 55°–59°. This aforementioned day saw HPM reach just 32°.
Fort Dix and Hammonton rose to 57° on the 24th, with 23 stations right behind at 55° or 56°. Statewide, the 25th was the warmest day of February. Hammonton, Red Lion (Burlington), Berkeley Township, and Fort Dix all topped out at 65°, 33 stations reached 60°–64°, and 18 from 55°–59° (Figure 14). Atlantic City Marina was coolest at 48°. The 26th was just a touch less warm, with four stations at 63°, 30 from 60°–62°, and 24 from 55°–59°. This time it was HPM coolest at 44°. Another ≥ 60° day occurred on the 27th, with Cape May Court House and Egg Harbor Township (Atlantic) at 65°, 15 sites from 60°–64°, and 20 from 55°–59°. Sicklerville (Camden), Hammonton, and Toms River reached 55° on the 28th.
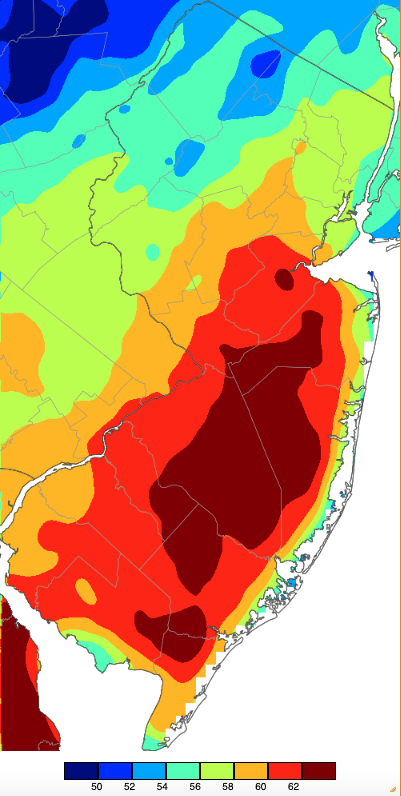
Figure 14. Maximum temperatures on February 27th based on a PRISM (Oregon State University) analysis generated using NWS, NJWxNet, and other professional weather stations.
Cold air rushed into New Jersey on the 1st and by midnight, HPM had fallen to 6°, High Point 10°, and eight NJWxNet stations from 11°–15°. The morning of the 2nd saw HPM down to 3°, six stations from 6°–10°, and 15 from 11°–15°, while Harvey Cedars (Ocean) only fell to 27°. HPM was 14° on the 5th, and Walpack (Sussex) 12° and HPM 13° on the 8th. Walpack reached 11° on the 10th with Sandyston (Sussex) 12° and five locations either 14° or 15°. Walpack and Sandyston dropped to 8° on the 11th followed by Charlotteburg (Passaic) 9° and eight stations from 12°–15°.
A six-day run of ≤15° minimums occurred from the 17th to 22nd. It began with HPM at 11° and High Point 15°. On the 18th, HPM fell to 6°, High Point 9°, Vernon Township 10°, and 12 stations from 11°–15°. The 19th was the coldest February morning when HPM bottomed out at 5°, seven NJWxNet stations were from 8°–10°, and 39 at 11°–15° (Figure 15). At 19°, West Cape May (Cape May) was least cold. Walpack, Sandyston, and HPM fell to 6° on the 20th, with three stations 9°–10° and 24 from 11°–15°. HPM reached a low of 11° on the 21st with four sites 13°–15°. The coldest lows on the 22nd included 11° at Berkeley Township and Woodland Township (Burlington) in the Pinelands, with 11° also found at HPM. Nine stations fell to 12°–15°.
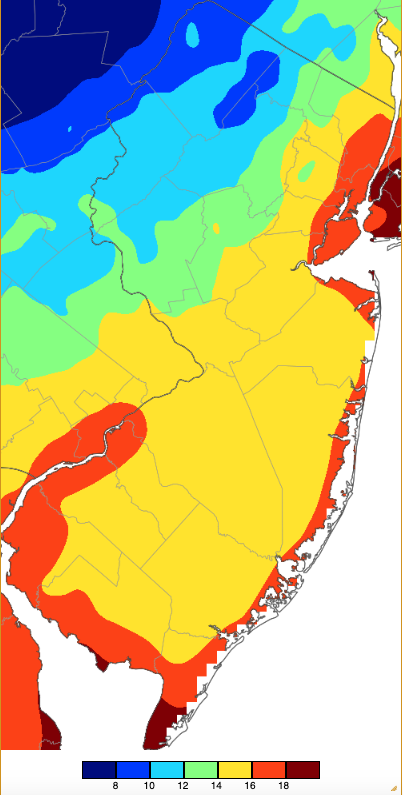
Figure 15. Minimum temperatures on February 19th based on a PRISM (Oregon State University) analysis generated using NWS, NJWxNet, and other professional weather stations.
Winter Overview
The winter of 2024/2025 (December–February) came in below normal in terms of precipitation, snowfall, and temperature. Precipitation (rain and melted snow/sleet) averaged 7.00” (Figure 16). This was 3.62” below the 1991–2020 normal and ranks as the 11th driest on record. This compares to a 16.29” total and 4th wettest ranking last winter. The northern climate division averaged 7.29” (-3.25”, 16th driest), the southern division 6.83” (-3.81”, 12th driest), and the coastal division 6.74” (-4.20”, 11th driest). Among NJ CoCoRaHS stations, the wettest was Mine Hill Township (Morris) at 9.63”, followed by Cranford Township (Union) 9.31”, Holland Township (Hunterdon) 9.29”, Denville Township (Morris) 9.26”, Bedminster Township (Somerset) 9.26”, and Branchburg Township (Somerset) 9.23”. The driest locations included Ocean City (Cape May) with 6.51”, Red Bank (Monmouth) 6.55”, Pitman (Gloucester) 6.79”, Lower Township (Cape May) 7.02”, Upper Freehold Township (Monmouth) 7.03”, and Upper Deerfield Township (Cumberland) 7.04”.
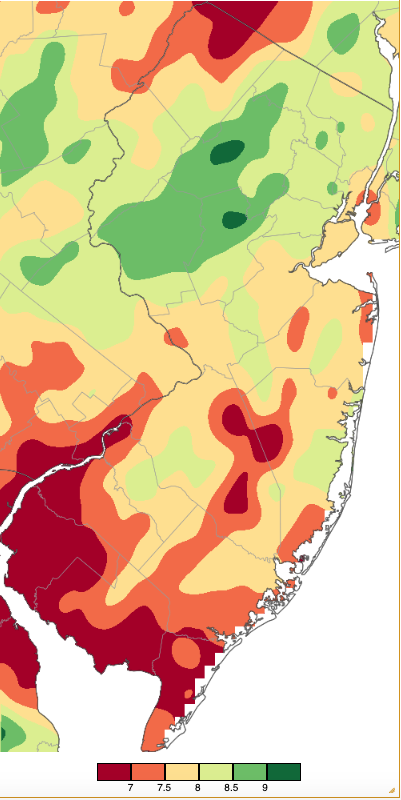
Figure 16. Winter 2024/25 (December 1st–February 28th) precipitation across New Jersey based on a PRISM (Oregon State University) analysis generated using NWS Cooperative, CoCoRaHS, NJWxNet, and other professional weather station observations. Totals range from 6.50”–6.99” (dark red) to 9.00”–9.49” (dark green).
The entire state remained under a Drought Warning throughout the winter, this designation first issued in November. With fall precipitation averaging 3.36” statewide, 8.35” below normal, the combined past six months found NJ precipitation totaled 10.36” which is a troublesome 11.97” below normal. This ranks as the second driest fall/winter period on record, only surpassed by the 10.04” in fall/winter 2001/2002; Table 3).
| Rank | Year | Fall/Winter Avg. Precip. |
|---|---|---|
| 1 | 2001/2002 | 10.04" |
| 2 | 2024/2025 | 10.36” |
| 3 | 1930/1931 | 13.65" |
| 4 | 1939/1940 | 13.85" |
| 5 | 1984/1985 | 13.87" |
| 6 | 1931/1932 | 14.25" |
| 7 | 1946/1947 | 14.30" |
| 8 | 1941/1942 | 14.31" |
| 9 | 1965/1966 | 14.99" |
| 10 | 1980/1981 | 15.38" |
Table 4. The 10 driest combined falls and winters on record across New Jersey since 1895/1896.
The US Drought Monitor also considered everywhere in the state to be in either moderate, severe, or extreme drought throughout the winter. Conditions eased somewhat as the season progressed, however the southeast remained in worst shape as February ended at the extreme level, with severe conditions to the immediate north and west and in the northern Highlands. Elsewhere, moderate drought conditions were found (Figure 17). Streamflow and groundwater levels continued to be below normal, and most reservoirs were close to 15% below seasonal averages.
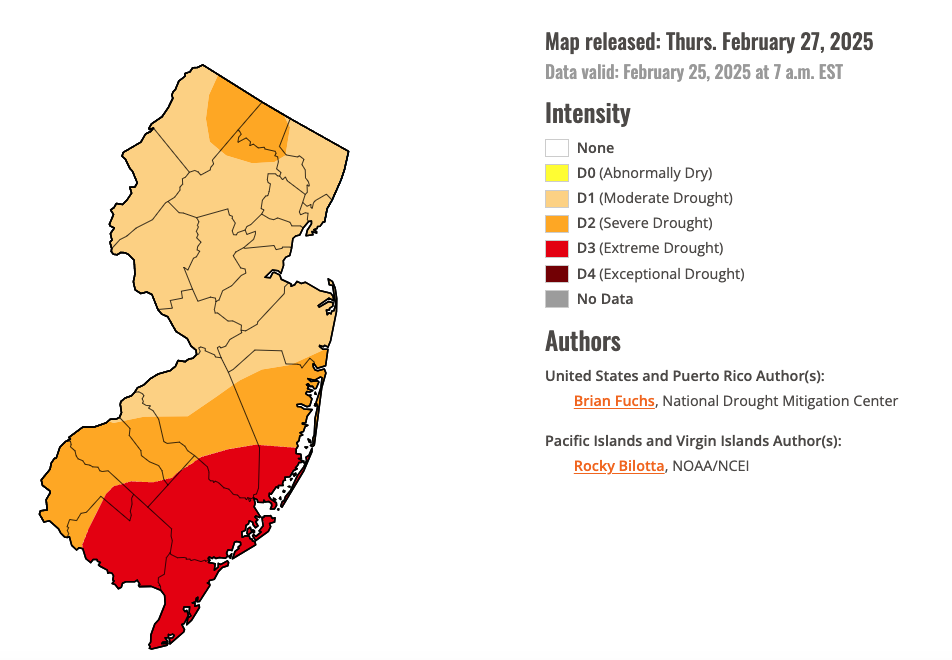
Figure 17. U.S. Drought Monitor map of conditions in NJ as of February 25, 2025.
Winter snowfall (December–February only) averaged 14.8”. This is 4.9” below normal and ranks as 55th least snowy since 1895. The snowiest winter totals included Mount Olive Township (Morris) with 26.8”, Mine Hill Township 25.3”, Vernon Township (Sussex) 25.3”, Sparta Township (Sussex) 25.2”, Rockaway Township (Morris) 24.6”, and Randolph Township (Morris) 24.0”. The season-to-date statewide snowfall (includes November) is 15.4”, which is 4.8” below normal and ranks 50th least snowy.
Winter temperatures across NJ averaged 32.3°. This was 1.7° below normal and ranks as the 55th mildest (75th coldest) since 1895. It was the coldest winter since 2014/2015 and the first one below normal since 2017/2018. The last time NJ experienced three consecutive below-normal months was November 2017–January 2018 and the last time the three winter months were all below normal was 2013/2014. The northern division averaged 29.5° (-1.9°, 55th mildest), southern division 34.0° (-1.7°, 55th mildest), and coastal division 34.8° (-1.7°, 54th mildest).
Central and non-coastal southern areas saw at least one winter day with a high temperature above 62° (Figure 18). The north and coastal areas had winter extreme highs mostly in the 58°–62° range.
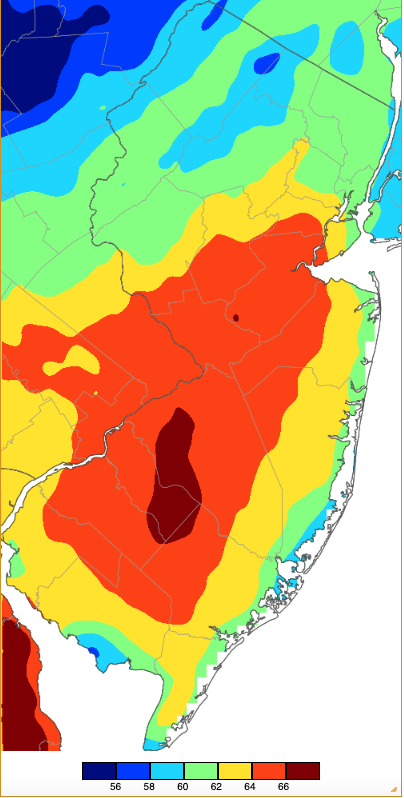
Figure 18. Extreme maximum temperatures during winter 2024/2025 based on a PRISM (Oregon State University) analysis generated using NWS, NJWxNet, and other professional weather stations. The seasonal maximum occurred on different days at different locations.
On the low end of the thermometer, seasonal extreme minimums were below -5° in the northwest, from 0° to -5° in north central and west central locations, and from 0° to 5° in most of the remainder of north and central and in south Jersey (Figure 19). There were exceptions, with 5° to 15° extreme lows in urban areas and along the Atlantic and Delaware Bay coasts.
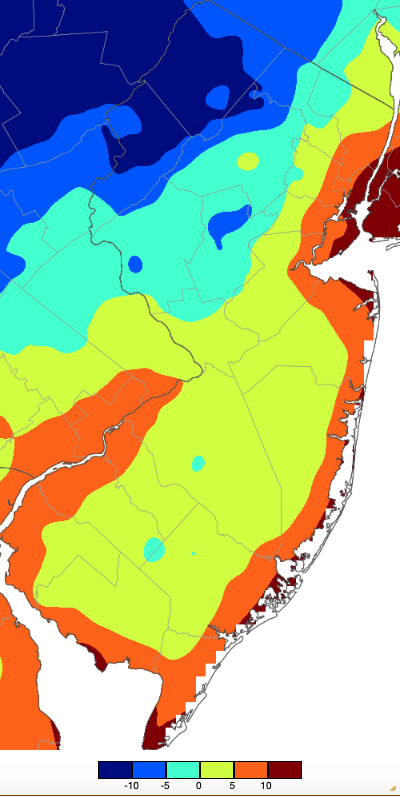
Figure 19. Extreme minimum temperatures during winter 2024/2025 based on a PRISM (Oregon State University) analysis generated using NWS, NJWxNet, and other professional weather stations. The seasonal minimum occurred on different days at different locations.


