Overview
Some Marches in past years have kept you guessing when, sometimes even if, spring will arrive. That certainly was not the case this year, nor, for that matter, has it been much so in recent years. With a statewide ranking of tenth warmest, March 2025 was the fourth of the past ten years to rank in the top ten. Eight of the sixteen mildest Marches in the past 131 years have occurred since 2000. Not even a late-season snow event occurred to temporarily stifle spring fever, as no measurable snow was observed anywhere in the state. Spring showers arrived and were plentiful enough to approach the statewide monthly normal. However, March finished as the seventh consecutive and tenth of the past eleven months with below-normal precipitation. As a result, there were multiple wildfires, rather common in NJ springs.
Looking more closely at numbers, the statewide March average temperature of 45.7° was 4.7° above the 1991–2020 normal and, as mentioned previously, ranked as the tenth mildest since records commenced in 1895 (Table 1). The average high was 57.2°, which is 6.3° above normal and ranks sixth mildest. The average low was closer to normal at 34.1°, which is 2.9° above normal and ranks thirteenth mildest (tied with three other years). The northern climate division averaged 43.6° (+4.8°, 11th mildest), the southern division 47.0° (+4.6°, 10th mildest), and the coastal division 46.4° (+4.2°, 9th mildest).
| Rank | Year | March Avg. Temp. |
|---|---|---|
| 1 | 2012 | 49.8° |
| 2 | 1945 | 48.8° |
| 3 | 1921 | 48.4° |
| 4 | 2016 | 47.0° |
| 5 | 1946 | 46.8° |
| 6 | 2020 | 46.3° |
| 7 | 2010 | 46.2° |
| 7 | 1903 | 46.2° |
| 9 | 2024 | 46.0° |
| 10 | 2024 | 45.7° |
| 11 | 2000 | 45.6° |
| 12 | 1977 | 45.0° |
| 13 | 1973 | 44.7° |
| 14 | 1929 | 44.1° |
| 15 | 2021 | 44.0° |
| 15 | 1936 | 44.0° |
Table 1. The 16 mildest Marches across NJ since 1895.
Statewide, March precipitation averaged 4.02” (Figure 1). This was 0.18” below normal and ranked as the 73rd driest/59th wettest of the past 131 years. The northern division averaged 3.30” (-0.71”, 54th driest/78th wettest), the southern division 4.40” (+0.08”, 85th driest/47th wettest), and the coastal division 5.08” (+0.66”, 100th driest/32nd wettest). For the third time in the last four months, rain fell after the morning observation time of most NWS Cooperative stations that are used to generate monthly totals. Thus, any rainfall later than the last day of the month is reported on the morning of the 1st of the succeeding month. In the next section, this March 31st rain will be discussed but it will be part of the April total, not the 4.02” just mentioned.
Despite this rain, long-term precipitation deficits remain, as do sub-normal groundwater, streamflow, and reservoir levels. Thus, NJ remained in a Drought Warning (NJ Department of Environmental Protection) and all the state remained in a stage of drought or abnormal dryness (US Drought Monitor) at month’s end.
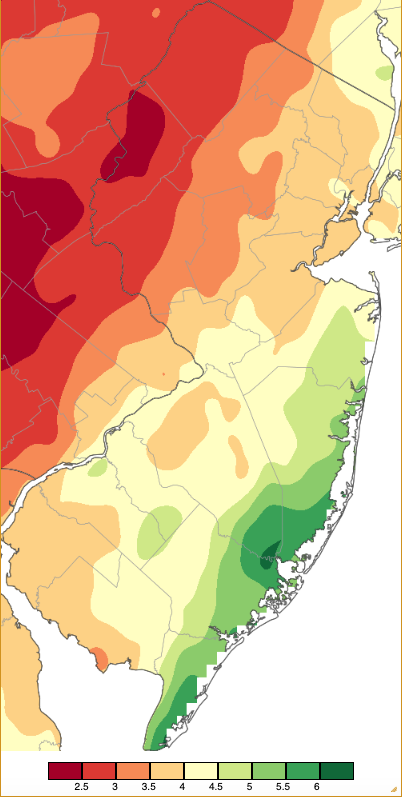
Figure 1. March 2025 precipitation across New Jersey based on a PRISM (Oregon State University) analysis generated using NWS Cooperative, CoCoRaHS, NJWxNet, and other professional weather station observations from 7 AM on February 28th to 8 AM on March 31st. Note the scale in inches at the bottom of the map. Totals range from 2.00”–2.49” (dark red) to 6.00”–6.49” (dark green).
With only a few snow flurries/squalls in northern locations on several occasions, as mentioned previously, there was no measurable snowfall statewide or in either the north, central, or south snow divisions. Thus, the state came in at 4.6” below normal, the thirteenth time since 1895 without measurable March snow. The north was 7.3” below normal (8th time at 0.0”), central -5.4” (20th at 0.0”), and south -4.6” (40th at 0.0”).
Precipitation and Storms
The southeast coast saw the most March rain. With 6.61”, Galloway Township (Atlantic County) topped all NJ Community Collaborative Rain, Hail, and Snow Network (CoCoRaHS) totals (as with state and divisional totals above, this does not include post-morning rainfall on the 31st). Lower Township (Cape May) was next highest at 6.50”, followed by Ventnor City (Atlantic) 6.28”, Port Republic (Atlantic) 6.27”, Stafford Township (Ocean) 5.89”, and Little Egg Harbor Township (Ocean) 5.88”. The northwest was driest, led by 2.19” in Blairstown (Warren), Frelinghuysen Township (Warren) 2.34”, Oxford Township (Warren) 2.40”, Montague Township (Sussex) 2.47”, Greenwich Township (Warren) 2.57”, and Holland Township (Hunterdon) 2.58”.
The month started off on a dry note with low humidity. This contributed to a wildfire in the Supawna Wildlife Refuge in Pennsville (Salem) on the afternoon of the 1st (Figure 2). Smoke from this blaze could be seen on radar extending well to the southeast (Figure 3). Winds that day gusted to 46 mph at Cream Ridge (Monmouth), Sea Girt (Monmouth), Little Egg Harbor Township, and Lower Alloways Creek Township (Salem, and situated close to the fire). There was another wildfire in Mercer County on the 2nd with a 44-mph gust observed at High Point Monument (HMP; Sussex).
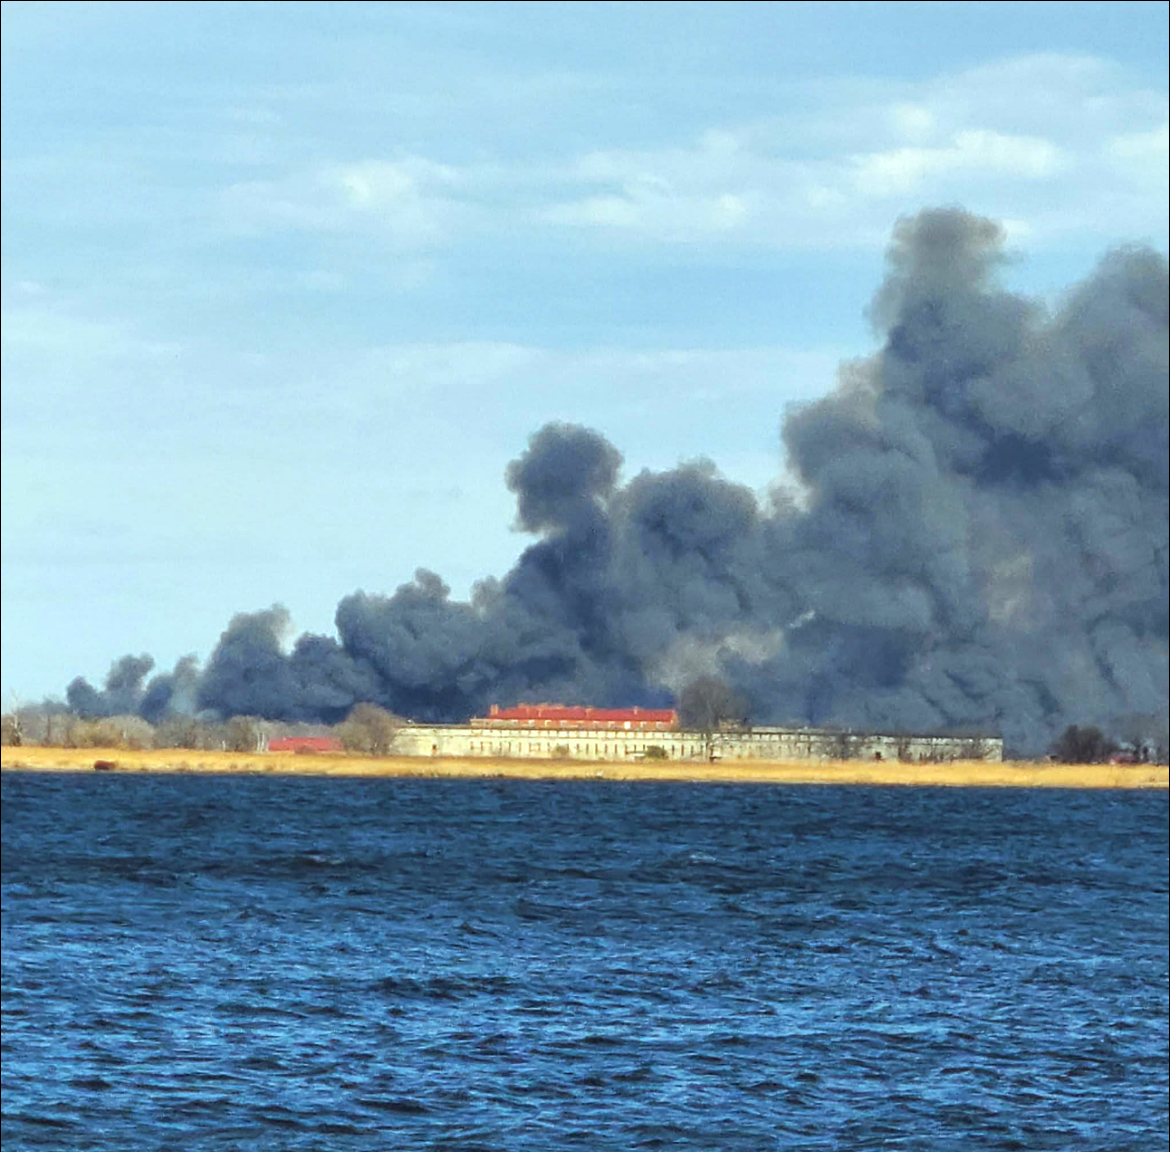
Figure 2. Brush fire in Supawna Wildlife Refuge, Pennsville (Salem) the afternoon of March 1st. Taken from the Delaware side of the Delaware River.
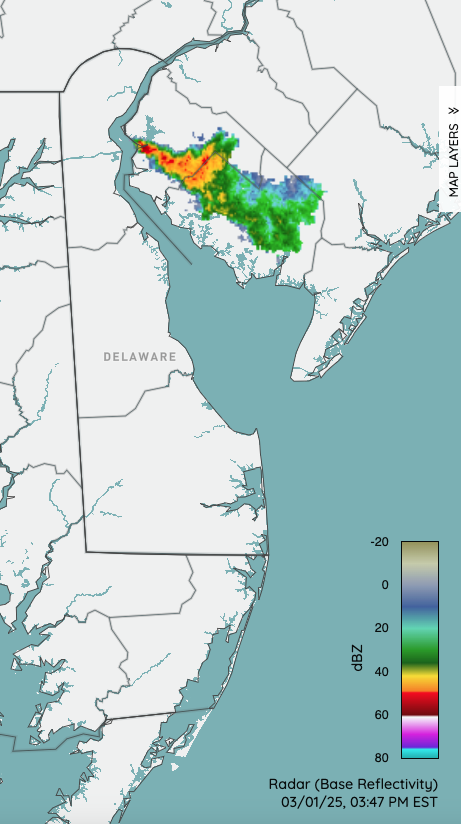
Figure 3. NWS radar at 3:47 PM on March 1st showing smoke moving southeast from the Supawna Wildlife Refuge fire.
Beneficial rain arrived during the afternoon and evening of the 5th, ending early on the 6th. Of 265 CoCoRaHS reports, Brigantine (Atlantic) emerged on top with 2.44”, followed by Ventnor City 2.30”, Galloway Township 2.23”, Stafford Township 2.07”, Port Republic 2.06”, Barnegat Light (Ocean) 2.06”, and 229 stations from 1.00”–1.99” (Figure 4). Portions of the northwest came in under an inch. On the 5th, winds gusted to 52 mph at Fortescue (Cumberland), 51 mph at both Vineland (Cumberland) and Woodbine (Cape May), and 40–49 mph at 20 other NJWxNet stations. Winds continued to howl on the 6th, again reaching 52 mph at Fortescue, 51 mph at HPM, and 40–49 mph at 18 stations. HPM topped out at 52 mph on the 7th when 17 stations reached 40–48 mph.
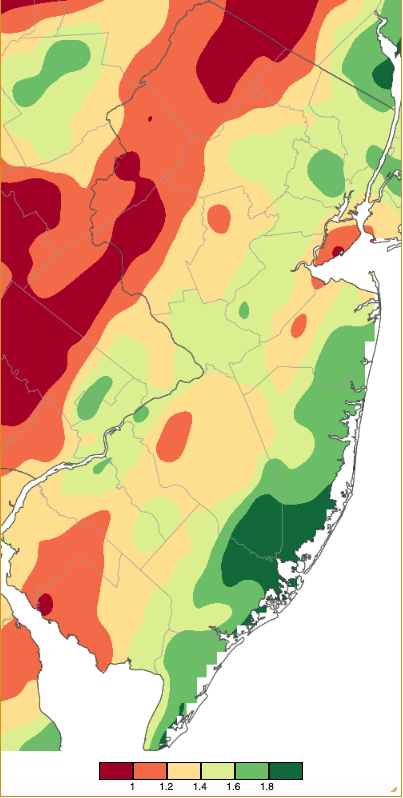
Figure 4. Precipitation across New Jersey from 7 AM on March 5th through 7 AM March 6th based on a PRISM (Oregon State University) analysis generated using NWS Cooperative, CoCoRaHS, NJWxNet, and other professional weather station observations. Note the scale in inches beneath the map.
The 8th brought reports of snow squalls in Wantage (Sussex) and Oakland (Bergen). HPM had a 43-mph gust and Wantage 42 mph. The next day, Little Egg Harbor Township reached 41 mph and Seaside Heights (Ocean) 40 mph. A wildfire occurred in Gloucester County on the 12th. The next notable rain arrived in the south on the 16th, spreading north to encompass the state and end early on the 17th (Figure 5). Excessive totals included three Lower Township stations with 3.57”, 3.06”, and 2.78”. Just to the north, Middle Township (Cape May) totals were 3.07” and 2.70”, with Galloway Township 2.95”, Ventnor City 2.85”, 14 stations from 2.00”–2.67”, and 126 from 1.00”–1.99” (of 270 total reports). Much of the north received under 1.00”. Thunder was reported in Atlantic and Cape May counties. Winds gusted to 49 mph at Cream Ridge and 40–47 mph at 13 stations on the 16th and to 45 mph at Atlantic City Marina (Atlantic) and 43 mph at HPM on the 17th.
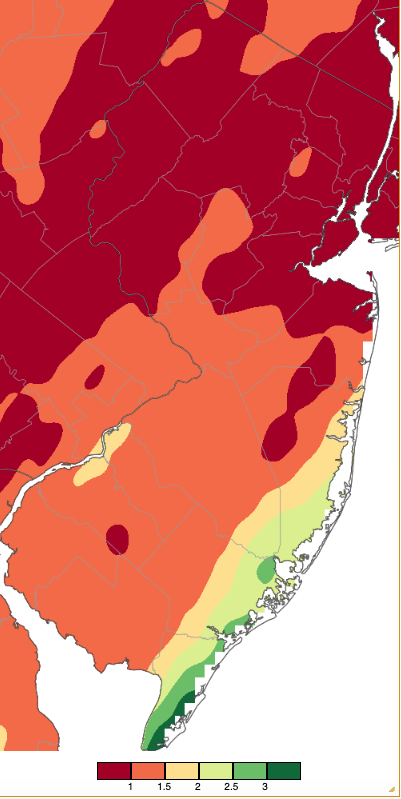
Figure 5. Precipitation across New Jersey from 8 AM on March 16th through 8 AM March 18th based on a PRISM (Oregon State University) analysis generated using NWS Cooperative, CoCoRaHS, NJWxNet, and other professional weather station observations. Note the scale in inches beneath the map, which differs from the Figure 4 scale.
Rain resumed on the evening of the 20th lasting into the early hours of the 21st. Of the 15 CoCoRaHS totals exceeding an inch, Middletown Township (Monmouth) had the most at 1.18”, Palisades Park (Bergen) 1.16”, Harrison (Hudson) 1.10”, and Montvale (Bergen) 1.08”. 205 of the 257 reports were an impressively uniform 0.50”–0.99”. Thunder was reported in Burlington and Sussex counties. Gusts to 50 mph were observed at HPM and Lower Alloways Creek Township on the 21st, with 10 stations reaching 40–48 mph. Gusts to 48 mph at Atlantic City Marina and 40–46 mph at nine locations followed on the 22nd. Vernon Township (Sussex) gusted to 47 mph on the 23rd. These winds fanned a wildfire in Wharton State Forest (Camden/Burlington) from the 22nd to 24th that burned through 2,336 acres.
Helping to extinguish the wildfire was predawn to afternoon rain on the 24th that brought Hammonton (Atlantic) 1.25”, Monroe Township (Gloucester) 1.25”, Deerfield Township (Cumberland) 1.22”, Manchester Township (Ocean) 1.21”, Fairfield Township (Cumberland) 1.08”, 11 stations from 1.00”–1.06”, and 94 sites from 0.50”–0.99” (of 261 reports). Squalls of snow and graupel were reported on the 26th in Morris, Warren, and Sussex counties.
As mentioned previously, the rain that fell during the late afternoon and evening of the 31st into the early hours of April 1st will be applied to April state, divisional, and station totals. However, given its abundance, it is worth mentioned in this report and not waiting another month for acknowledgment. Accompanied by frequent lightning and thunder in many locations, totals amounted to 2.17” at Hackettstown (Warren), White Township (Warren) 2.13”, Mansfield Township (Burlington) 1.98”, Washington Township (Warren) 1.88”, Oxford Township 1.85”, Greenwich Township (Warren) 1.81”, Liberty Township (Warren) 1.81”, and 1.00”–1.78” at 151 sites (267 reports). The heaviest totals were in portions of the northwest that had reported some of the lowest monthly totals through the morning of March 31st. Thus, adding storm totals to those considered “official” for March results in quite a different looking map from March 1st to April 1st (Figure 6) than that seen earlier for March 1st to 31st (Figure 1).
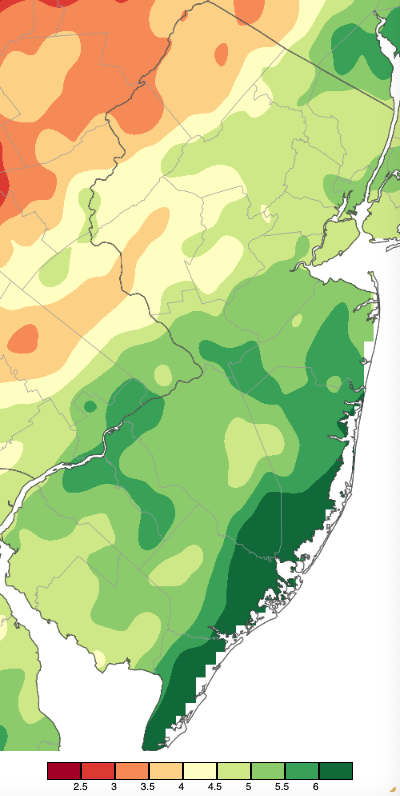
Figure 6. Precipitation across New Jersey based on a PRISM (Oregon State University) analysis generated using NWS Cooperative, CoCoRaHS, NJWxNet, and other professional weather station observations from 7 AM on February 28th to 8 AM on April 1st. Note the scale in inches at the bottom of the map. Totals range from 2.00”–2.49” (dark red) to 6.00”–6.49” (dark green). Adding the 24 hours from 8 AM March 31st to 8 AM April 1st changes the monthly map in Figure 1 considerably. All values from 2.00”-2.99” disappear and the area of 6.00”-6.49” totals increase considerably.
The lowest barometric pressure of the month was in the 29.15”–29.25” range on the 6th. The highest from 30.20”–30.35” on both the 3rd and 27th. Winds gusted to 40 mph or higher at one or more Rutgers NJ Weather Network stations on 14 March days, four of them with stations gusting to 50 mph or greater. This included the 12 days previously mentioned and two others on the 29th when Little Egg Harbor Township reached 42 mph and two other stations 40 mph, plus Fortescue at 49 mph and Lower Alloways Creek Township 43 mph on the 31st.
The US Drought Monitor of April 1st showed improvement from conditions at the start of the month. Areas of D2 and D3 shrank and improvements to D0 appeared and grew over central sections. Only the D2 region in the northern Highlands remained steady, as rainfall continued not to be as plentiful in this area as elsewhere.
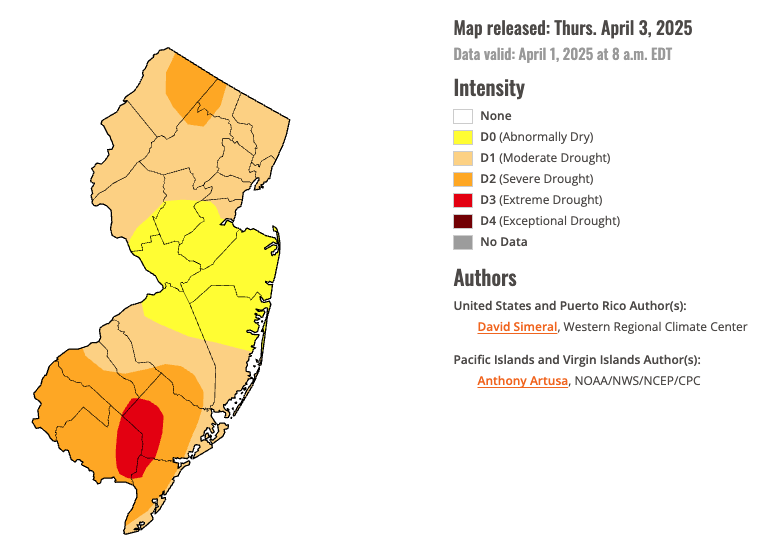
Figure 7. U.S. Drought Monitor map of conditions in NJ as of April 1, 2025.
Temperature
What might be called thermal whiplash occurred on multiple occasions in this transitional month. A monthly range of 78° between highest and lowest temperatures at NJWxNet stations certainly exemplifies this. Looking first at low temperatures, 25 days saw one or more of the 69 stations below freezing but just two days with all sites 32° or colder. There were seven days where one or more station was 20° or colder, including the first four days of the month. On the 1st, HPM dipped to 14° with four stations from 17°–20°. The 2nd saw this month’s coldest reading of 8° at HPM with 11 stations from 12°–15° and 40 from 16°–20°. Atlantic City Marina was mildest at 23°. The 3rd edged out the 2nd as the overall coldest March day. Berkeley Township (Ocean) fell to 10°, 15 stations were from 11°–15°, and 40 from 16°–20° (Figure 8). Three coastal stations only reached 25°. The 4th found Walpack (Sussex) at 15° and 11 sites from 17°–20°. Walpack fell to 16° on the 9th with 7 stations from 18°–20°. Later in the month, HPM bottomed out at 19° on the 23rd and Walpack 20° on the 27th.
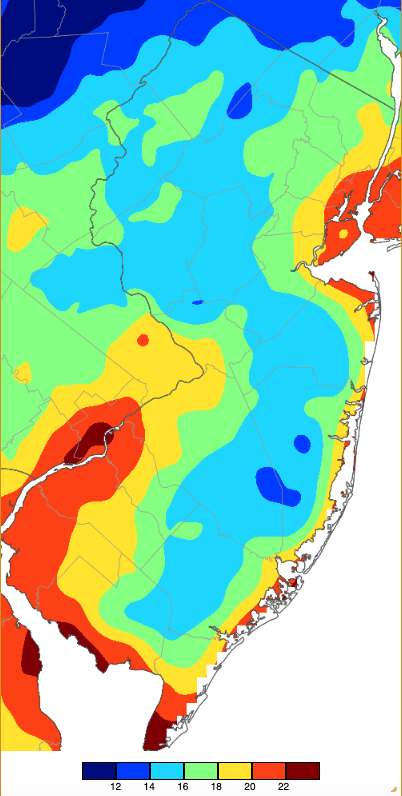
Figure 8. Minimum temperatures on March 3rd based on a PRISM (Oregon State University) analysis generated using NWS, NJWxNet, and other professional weather stations. Note the 2° scale beneath the map.
On the warm side of the ledger, maximum temperatures at NJWxNet stations were above freezing at all stations on 29 days. There was not a day when all stations remained below freezing. There were seven days with one or more stations reaching 70° or warmer. The first of these was the 11th, with Fort Dix (Burlington) and Red Lion (Burlington) at 72° and 17 stations either 70° or 71°. This day began on the cold side, thus diurnal temperature ranges exceeded 40° at several locations. This included Walpack (22°–70°), Pequest (Warren; 25°–70°), Hillsborough-Duke (Somerset; 26°–70°), Red Lion (29°–72°), and Hammonton (28°–71°). The cold experienced in valley locations that morning was not seen at higher elevations subject to a strong inversion, thus, for example, the Vernon Township station atop Mountain Creek Ski area had a morning low of 47°, rising just 17° in the afternoon to 64°. Hillsborough-Duke and Mansfield Township rose to 72° on the 16th, with 17 sites 70° or 71°. The 20th found West Deptford (Gloucester) at 71° and two stations 70°.
March finished with a warm flare beginning on the 29th, which proved to be the warmest day of the month. Howell (Monmouth) and Wall (Monmouth) each crested at 86°, 45 stations reached 80°–85°, and 21 from 73°–79° (Figure 9). The only station cooler was Fortescue, where a southerly wind flowing over cool Delaware Bay waters kept the high at 62°. The evening of the 29th saw a dramatic decline in temperature moving from the northeast corner of the state southwestward. The impact of this “backdoor” cold front can be seen in maps at 5:37 PM as the front began moving into NJ (Figure 10) and at 8:42 PM when the front made it to the border of Ocean and Burlington counties (Figure 11). The most dramatic thermal transition was at the New Brunswick (Middlesex) NJWxNet station where, within 5 minutes, the temperature plummeted from 76° to 53° (Figure 12).
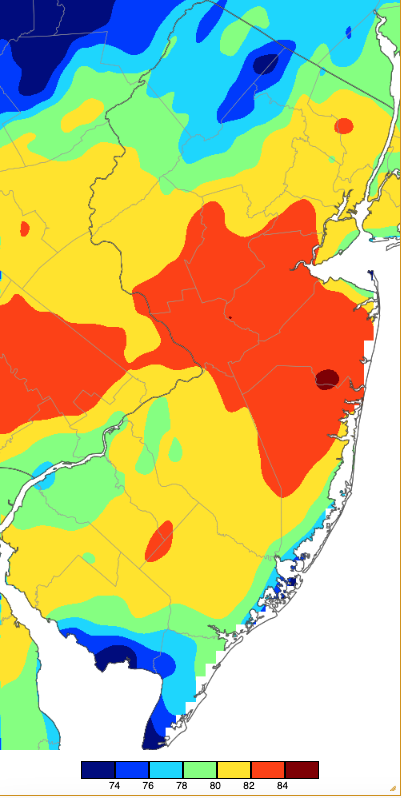
Figure 9. Maximum temperatures on March 29th based on a PRISM (Oregon State University) analysis generated using NWS, NJWxNet, and other professional weather stations.
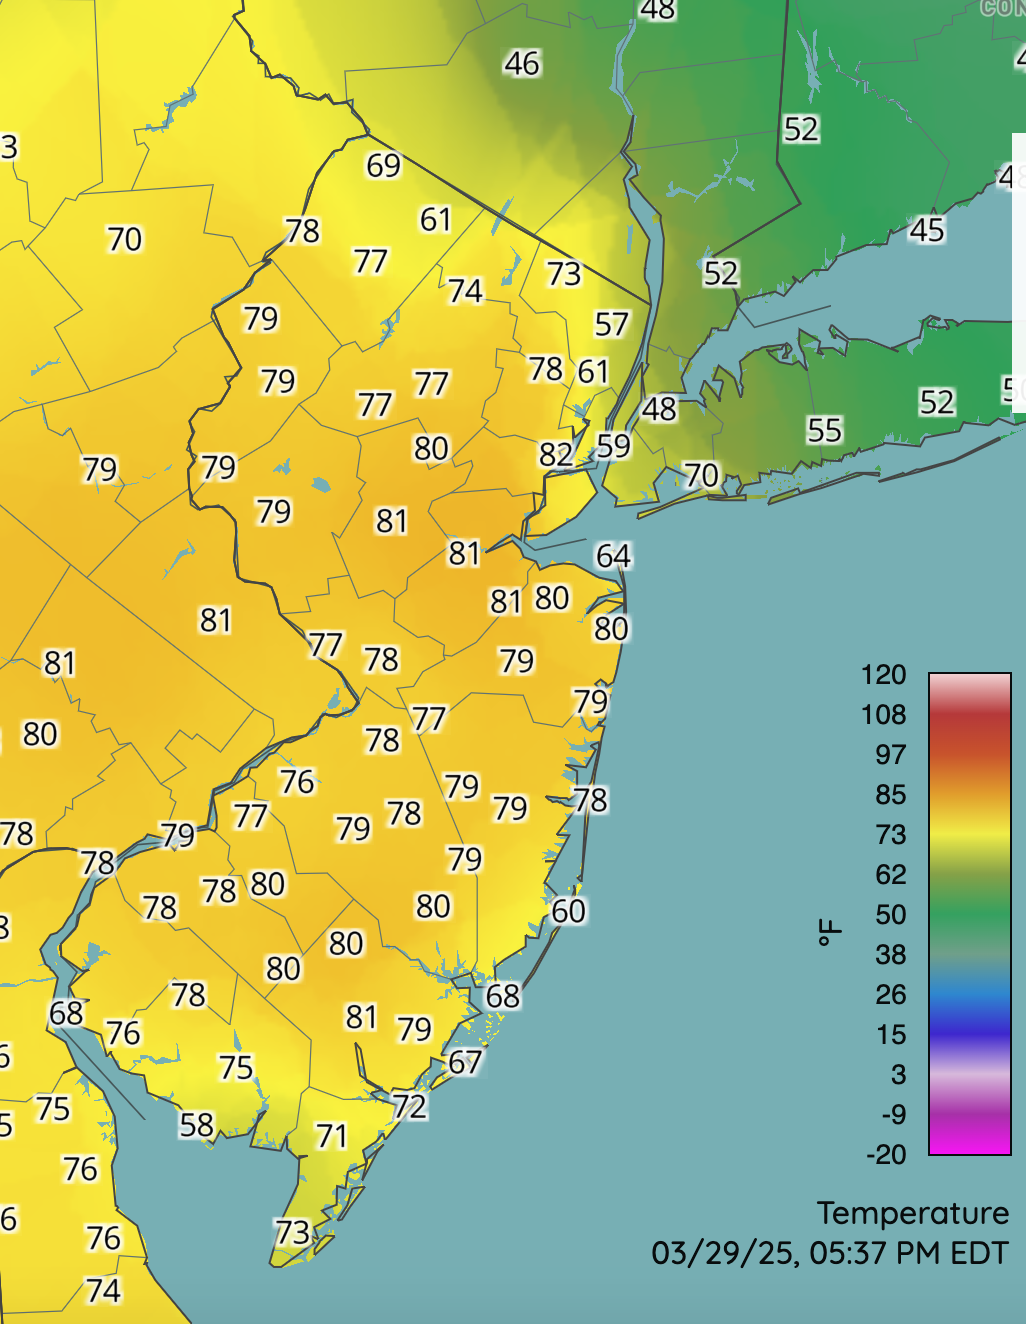
Figure 10. Temperatures at around 5:37 PM on March 29th at NJWxNet, NWS, and other professional weather stations.
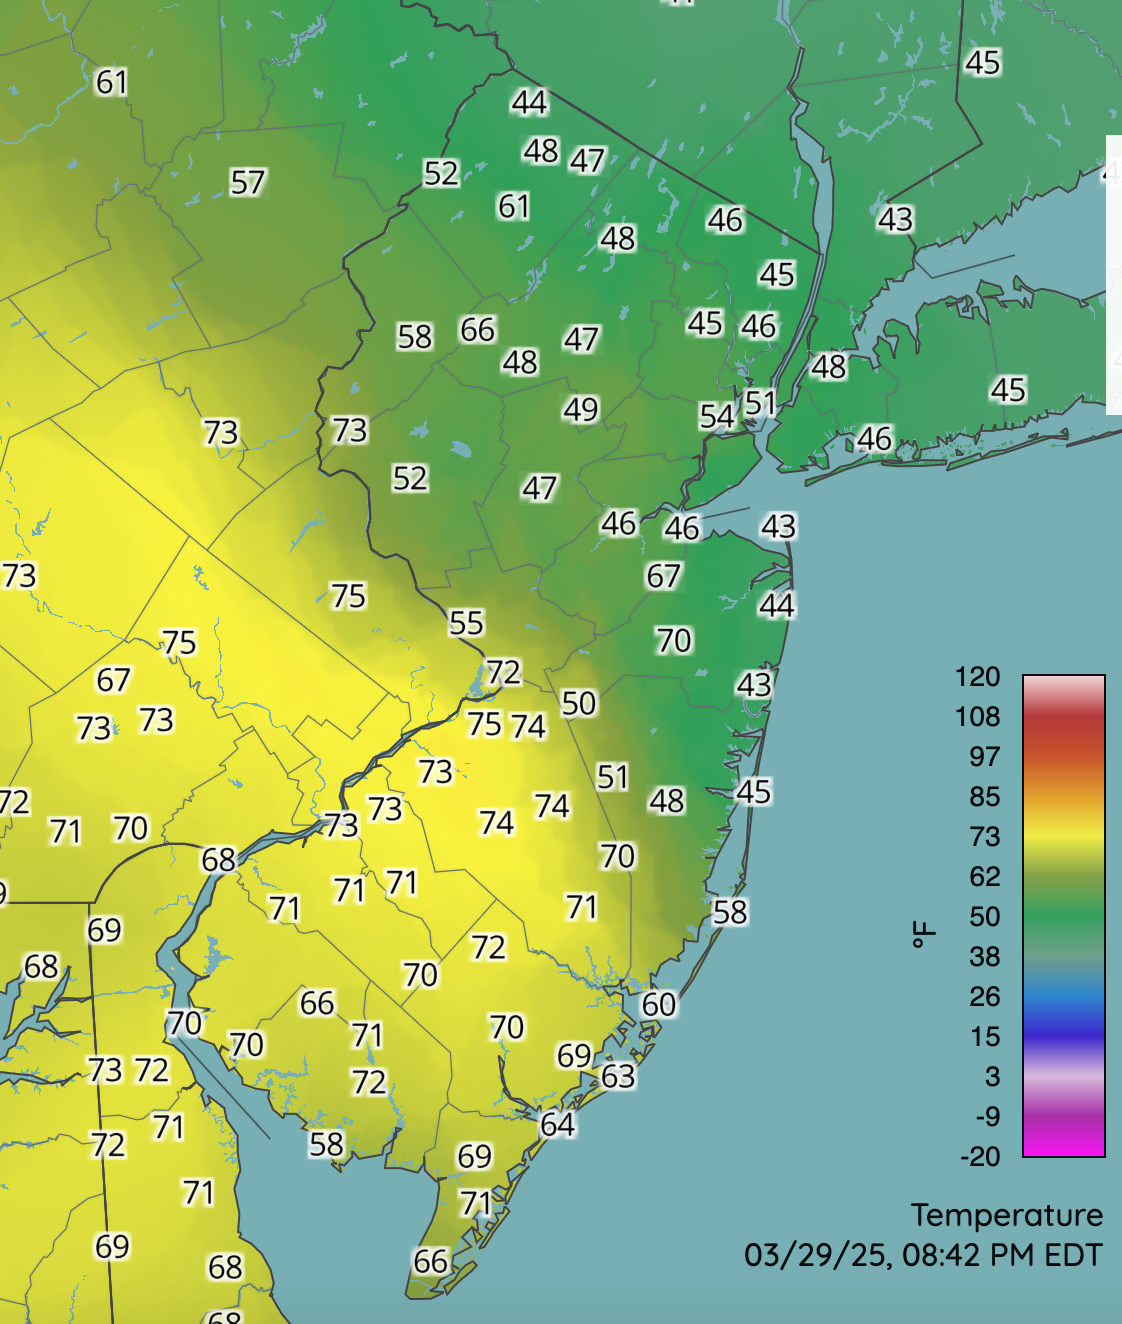
Figure 11. Temperatures at around 8:42 PM on March 29th at NJWxNet, NWS, and other professional weather stations.
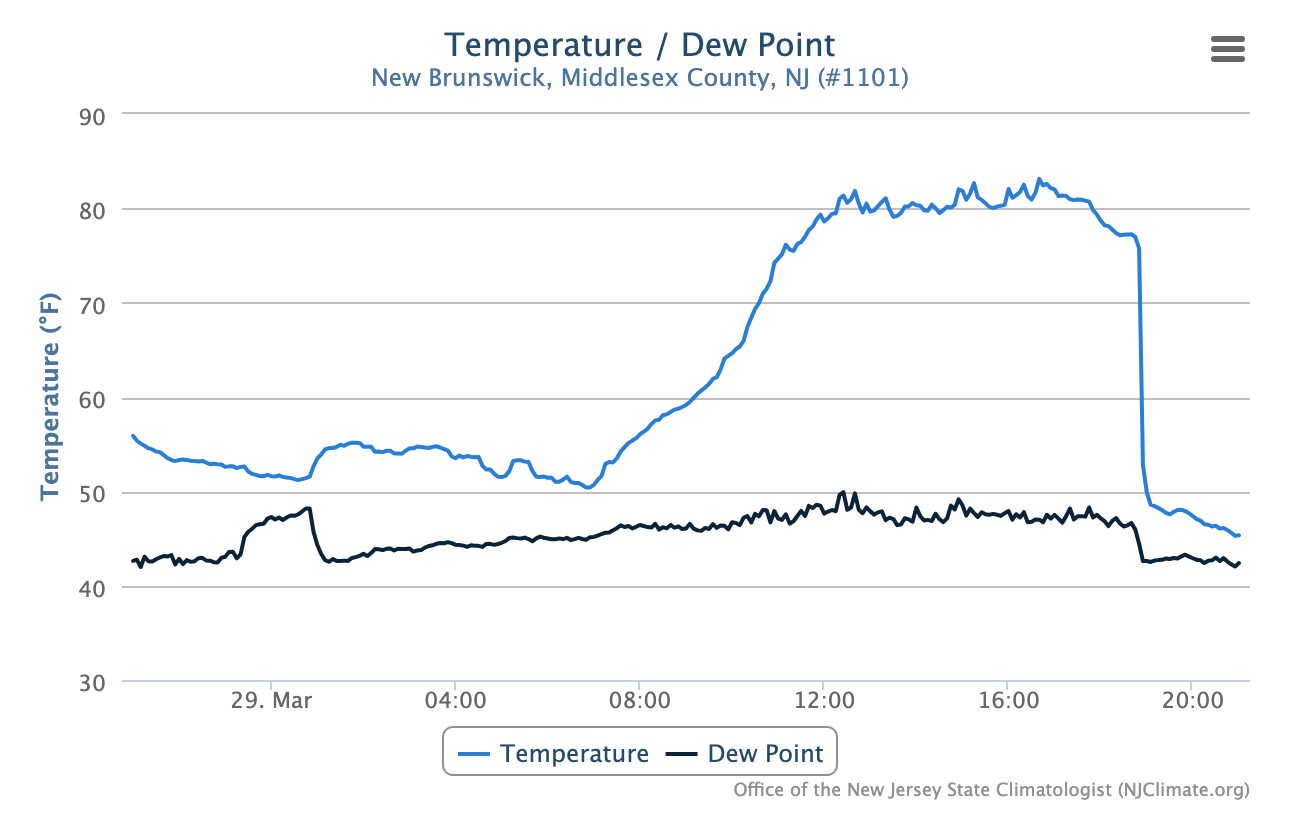
Figure 12. Temperature and dew point temperature observations at New Brunswick from approximately 9:00 PM March 28th to 9:00 PM March 29th at NJWxNet, NWS, and other professional weather stations. Displayed is a 23° temperature decline in the five minutes between 6:50 PM (76°) and 6:55 PM (53°) following an afternoon high of 83°.
The backdoor front failed to settle south of NJ, retreating northward as a warm front on the 30th and raising afternoon temperatures to 77° at Mannington (Salem) and Piney Hollow (Gloucester), with nine other south Jersey stations from 70°–75°. Meanwhile, well north of the front, HPM reached a daily high of just 41°. The front retreated north of NJ on the 31st with Hammonton, Sicklerville (Camden), and West Deptford all climbing to 83°, 28 sites reached 80°–82°, and 30 locations rose to 70°–79°. This time, an onshore breeze led to Atlantic coastal locations being coolest, with Atlantic City Marina up to just 58°.


