Overview
January 2023 was unlike most any first month of the year a New Jersey resident has experienced. Temperatures were similar to those normally seen in March and accumulating snowfall was meager in the north and non-existent further south. NJ weather was more like that of the piedmont of North and South Carolina at this time of year. The statewide average temperature of 41.0° was 9.3° above the 1991–2020 normal and ties with 1932 as the mildest January since records commenced in 1895 (Table 1). The average high of 48.9° was 8.6° above normal, ranking 2nd mildest. The average low of 33.1° was 9.9° above normal, also ranking 2nd mildest. It is indeed impressive to see the January 2023 monthly mean 0.7° warmer than the normal monthly high temperature and the average low was 1.4° above the normal monthly mean. The NCEI northern division averaged 38.8° (+9.9°, rank #1), the southern division 42.3° (+8.9°, #2), and the coastal division 43.0° (+8.6°, #2).
The 2023 January average would be a record for February and would be the 5th warmest December of the past 129 years. It was warmer than 20 of the past 128 Novembers and 76 of the past 128 Marches. A number of locations averaged above normal every day of the month, with others at or just below normal on a few days.
| Rank | Year | January Avg. Temp. |
|---|---|---|
| 1 | 2023 | 41.0° |
| 1 | 1932 | 41.0° |
| 3 | 1950 | 39.7° |
| 4 | 1998 | 38.8° |
| 5 | 2006 | 38.7° |
| 6 | 1913 | 38.2° |
| 7 | 1990 | 38.0° |
| 7 | 1937 | 38.0° |
| 9 | 2020 | 37.3° |
| 9 | 1933 | 37.3° |
Table 1. The ten mildest Januarys across NJ since 1895.
January precipitation averaged 3.65” across NJ, which is 0.16” above normal and ranks as the 45th wettest on record (Figure 1). This includes rain that fell during the PM hours of December 31st, as the clock starts on the new month (and in this case, also the new year) once observations are gathered at most NWS Cooperative stations around 7–8 AM each morning (much as what occurred on November 30, 2022, contributing to December totals). The northern division was wettest, averaging 4.19” of rain and melted snowfall (+0.69”, 31st wettest), the southern division 3.36” (-0.11”, 56th wettest), and the coastal division 3.01” (-0.50”, 78th wettest/52nd driest).
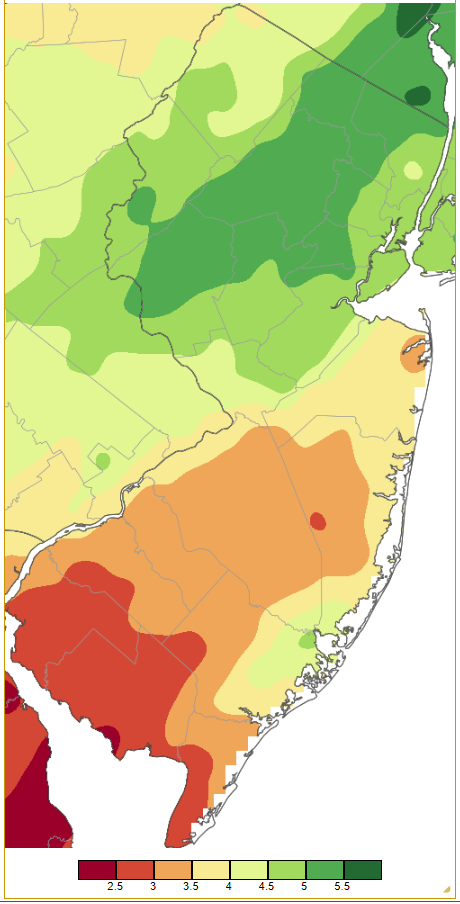
Figure 1. January 2023 precipitation across New Jersey based on a PRISM (Oregon State University) analysis generated using NWS Cooperative and CoCoRaHS observations from 7 AM on December 31st to 7 AM on January 31st. Note the scale in full inches at the bottom of the map. Totals range from 2.00”–2.49” (dark red) to 5.50”–5.99” (dark green).
January snowfall averaged 0.5” across the state, with measurable snowfall (0.1” or more) only occurring in northern areas, much like December 2022. The state average was 6.7” below normal and ranks 3rd least since 1895 (Table 2). The ONJSC northern division average was 1.5” (-7.9”, 10th least), central 0.4” (-7.3”, 5th least), and southern 0.0” (-5.7, least snow on record, tied with 8 others). Adding insult to injury for snow fans, most areas south of Interstate 78 had yet to see measurable snowfall during the entire season-to-date. This was a record late start to the snow season in some locations, including New Brunswick (Middlesex County) where the previous record for snow futility was January 31, 1921 (when 0.9” fell). January 23, 1966, falls to third place. Records extend back to the 1894/1895 snow season (the record is now February 1, 2023, as 0.2” fell on that day).
| Rank | Year | January Avg. Snow |
|---|---|---|
| 1 | 1934 | 0.2" |
| 2 | 1995 | 0.4" |
| 3 | 2023 | 0.5" |
| 3 | 1913 | 0.5" |
| 5 | 1950 | 0.7" |
| 6 | 1924 | 0.8" |
| 7 | 1967 | 0.9" |
| 7 | 1933 | 0.9" |
| 9 | 2008 | 1.0" |
| 10 | 2021 | 1.1" |
| 10 | 1998 | 1.1" |
| 10 | 1919 | 1.1" |
Table 2. The 12 least snowy Januarys across NJ since 1895.
Temperature
There were seven early spring-like days in January where more than one of the 66 Rutgers NJ Weather Network (NJWxNet) stations reached a high of 60° or greater. This included the first five days of 2023, beginning with Atlantic City Marina (Atlantic) and Woodbine (Cape May) up to 60° on the 1st. The 2nd found Hammonton (Atlantic) at 64°, Mullica (Atlantic), Vineland (Cumberland), and Piney Hollow (Gloucester) each 62°, and nine stations either 60° or 61°. Both Cape May Court House (Cape May) and Woodbine topped out at 67° on the 3rd, followed by Mannington (Salem) and Vineland each 66°, and 25 stations from 60°–65°. Sandyston (Sussex) was coolest at 48°. The 4th was the warmest day of the month, with a balmy 71° observed at Egg Harbor Township (Atlantic). The Figure 2 map shows the warmth concentrated in the south, except where southerly winds brought some cooler air off Delaware Bay into nearby coastal areas. Nine stations got to 69°, 34 from 65°–68°, and 21 from 60°–64°. Fortescue (Cumberland) was coolest at 59°. The NWS Atlantic City Airport station in Pomona (Atlantic) reached a record high of 70°.
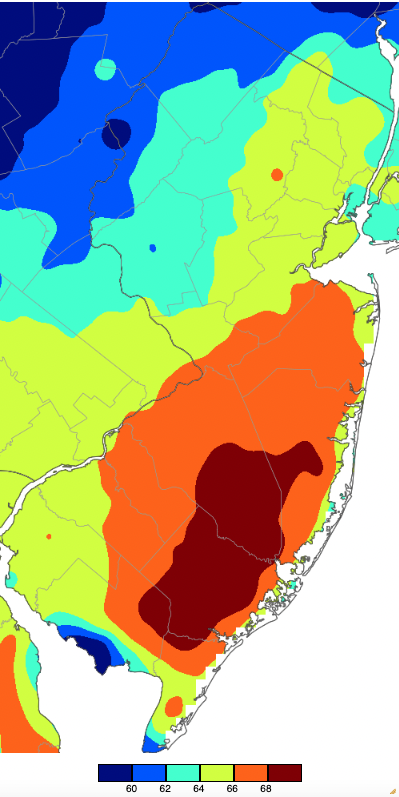
Figure 2. Maximum temperatures on January 4th based on a PRISM (Oregon State University) analysis generated using NWS, NJWxNet, and other professional weather stations. Note the 2-degree scale beneath the map.
The 5th found Piney Hollow mildest at 64°, with 33 stations grouped closely together from 60°–63°. A week later, Moorestown (Burlington) rose to 61° and five other spots hit 60°. Hammonton reached 61° on the 13th, with Howell (Monmouth) and Oswego Lake (Burlington) each at 60°.
There were only six January days when the temperature fell to 20° or lower at NJWxNet stations. In fact, every station remained above 36° from the 3rd–5th. Not until the 15th did a minimum fall to 20°, this being achieved at High Point (Sussex). The 16th was the coldest day of the month, with Walpack (Sussex) down to 13°, Pequest (Warren) 14°, and seven stations from 18°–20°. Only the northwest saw temperatures in the teens and lower 20°s (Figure 3). Walpack made it down to 18° on the 17th. Toward month’s end, Walpack and Hopewell Township (Mercer) dropped to 20° on the 27th, Hopewell Township was 19° and Walpack and Berkeley Township (Ocean) each 20° on the 28th, and High Point Monument (Sussex) 18° and Vernon Township (Sussex) and High Point each 20° on the 31st.
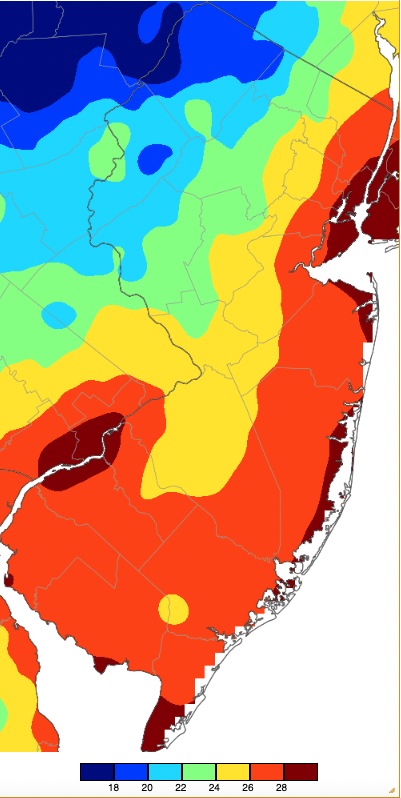
Figure 3. Minimum temperatures on January 16th based on a PRISM (Oregon State University) analysis generated using NWS, NJWxNet, and other professional weather stations. Note the 2-degree scale beneath the map.
Precipitation and Storms
The month passed without a truly substantial or meaningful storm. As Figure 1 depicts, the north received the most precipitation, led by the Glen Rock (Bergen) Community Collaborative Rain, Hail, and Snow Network (CoCoRaHS) station with 5.95”. This was followed by Wayne (Passaic) at 5.91”, Lebanon (Hunterdon) 5.82”, Chester Township (Morris) 5.81”, Randolph Township (Morris) 5.75”, and Little Falls (Passaic) 5.72”. The far south received the least rain, with Middle Township (Cape May) catching 2.32”, Lower Township (Cape May) 2.41”, Upper Deerfield (Cumberland) 2.61”, Millville (Cumberland) 2.73”, Pittman (Gloucester) 2.74”, and South Harrison (Gloucester) 2.83”. The most snowfall amongst CoCoRaHS stations was Vernon Township at 7.7”, Sparta (Sussex) 5.0”, Holland Township 3.7”, and Hardyston (Sussex) 3.3”.
As mentioned previously, an event from the afternoon of December 31st to early on January 1st counts toward the January and 2023 totals. Brigantine (Atlantic) caught the most with 1.34” followed by Linwood (Atlantic) at 1.06”, and 37 CoCoRaHS stations from 0.50”–0.99”. There were approximately 250 CoCoRaHS reports for most of the January events reported here, including a rain event on the 3rd that saw Secaucus (Hudson) on top with 0.85” and 55 stations close behind from 0.50”–0.84”.
A squall line moved southwest to northeast through NJ during the late afternoon and evening of the 12th. Thunder was heard in multiple locations and some small hail fell in a few southern spots. The fast-moving line only dropped as much as 0.66” at Stillwater Township (Sussex) and 0.61” in Montague (Sussex). Thunder was once again heard in many locations on the 19th when rain fell through most of the day and into early on the 20th. Lebanon led the way with 1.35”, followed by Brick (Ocean) at 1.34”, Point Pleasant Beach (Ocean) 1.31”, and Woodbridge (Middlesex) 1.28”. Most of the state received a soaking rain, with 139 CoCoRaHS locations catching 1.00”–1.35” and 86 from 0.50”–0.99” (Figure 4). Wildwood Crest (Cape May), with 0.07”, received the least.
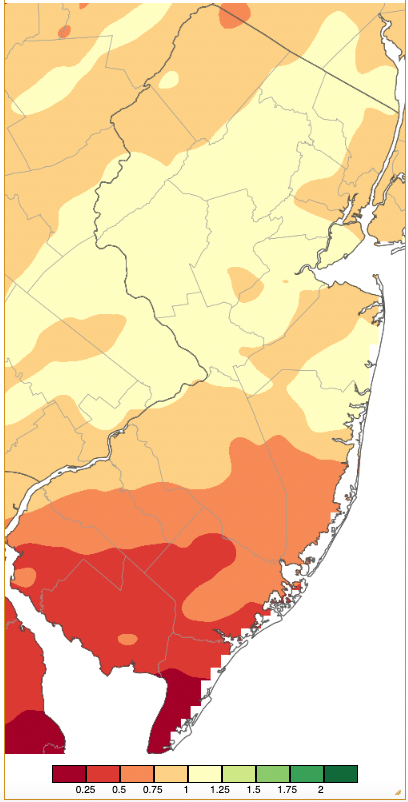
Figure 4. Precipitation across New Jersey from 7 AM on January 18th through 7 AM January 20th based on a PRISM (Oregon State University) analysis generated using NWS Cooperative and CoCoRaHS observations. Note the scale in inches beneath the map.
An event between the afternoons of the 22nd and 23rd brought mostly cold rain to the state, however, accumulating snow fell at higher elevations in the north. Rain and melted snow amounted to as much as 1.22” in South Brunswick (Middlesex) and 1.18” in Tenafly (Bergen), Princeton (Mercer), and Franklin Township (Somerset). Some 34 stations received 1.00”–1.22” and 194 from 0.50”–0.99” (Figure 5). Hamilton (Atlantic) received the least with 0.26”. Snowfall reached 1.0” at locations in four counties, the highest values being: Sussex: Highland Lakes (7.7”) and Stockholm (4.5”), Morris: Green Pond (3.3”), Passaic: West Milford (1.2”), and Hunterdon: Bethlehem Township (1.5”). With a new moon and some persistent onshore winds, some minor back-bay flooding occurred during the fourth week of the month.
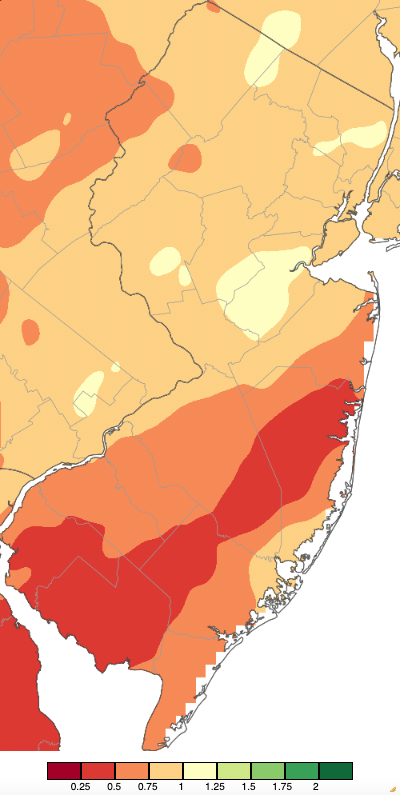
Figure 5. Precipitation across New Jersey from 7 AM on January 22nd through 7 AM January 24th based on a PRISM (Oregon State University) analysis generated using NWS Cooperative and CoCoRaHS observations. Note the scale in inches beneath the map.
The final storm of the month was the wettest. It began early on the 25th with some light snow in the north. Early in the afternoon, snow briefly accumulated in northern and west central areas before being washed away with heavier evening rains that lasted into the pre-dawn hours of the 26th. Roxbury Township (Morris) caught 2.25” of rain and melted snow, followed by 2.22” and 2.16” at two Glen Rock stations, Hawthorne 2.22”, Montvale (Bergen) 2.16”, and Little Falls 2.15”. A total of 2.00”–2.25” fell at 16 CoCoRaHS stations, 1.50”–1.99” at 68 sites, and 1.00”–1.49” at 125 locations (Figure 6). Maurice River (Cumberland) saw the least with 0.72”. Snowfall reached 1.0” at locations in six counties, the highest values being: Hunterdon: Holland Township (2.6”), Warren: Greenwich (2.1”), Morris: Washington Township (2.0”), Passaic: West Milford (1.3”), Sussex: Sparta (1.2”), and Somerset: Bernards (1.0”). Minor river and stream flooding occurred within portions of the Raritan and Passaic basins.
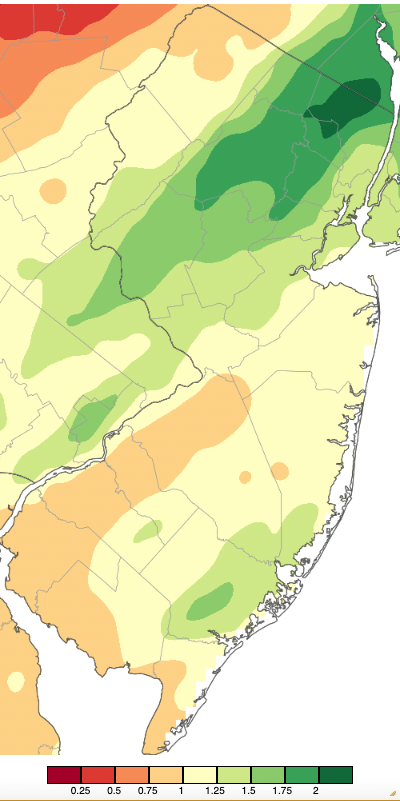
Figure 5. Precipitation across New Jersey from 7 AM on January 22nd through 7 AM January 24th based on a PRISM (Oregon State University) analysis generated using NWS Cooperative and CoCoRaHS observations. Note the scale in inches beneath the map.
The lowest barometric pressures of the month occurred on the 26th, generally ranging from 29.40”–29.50”. The highest pressures were on the 8th and 28th, reaching 30.30”–30.40” in both cases. These relatively low maxima exemplify the absence of cold Arctic high pressure throughout the month.
Winds gusted to 40 mph or higher on seven January days. It should be noted that the High Point Monument anemometer was out of commission from the 1st–16th and the 23rd–24th. Given that this site is often the windiest in the state, there may be a few days where 40 mph gusts were missed. Still, conditions were not too windy across NJ early in the month until a gust of 46 mph was observed at Atlantic City Marina on the 13th. This was followed by a 41 mph at Lower Alloways Creek Township (Salem) on the 14th. High Point Monument gusted to 43 mph on the 18th. Seaside Heights (Ocean) and Little Egg Harbor Township (Ocean) reached 41 mph and Lower Alloways Creek Township 40 mph on the 20th. Wantage (Sussex) gusted to 42 mph on the 23rd. The 25th and 26th were the windiest days of the month. On the 25th, Harvey Cedars (Ocean) was up to 52 mph, Lower Alloways Creek Township 41 mph, and both Berkeley Township and Fortescue 40 mph. The 26th saw gusts to 45 mph at High Point Monument, Harvey Cedars, and Pennsauken (Camden), and 40–43 mph gusts occurred at four other NJWxNet stations.
At month’s end, the US Drought Monitor depicted abnormally dry conditions in the far south. Sufficient precipitation fell in the north such that the long-term abnormally dry designation was eliminated from the Highlands.


