May Overview
In recent years, many a comment has been heard that New Jersey just does not have a spring season any more. We go right from winter to summer weather, people say. The same cannot be said for spring 2020. A seasonal summary follows at the end of this report and the individual March and April reports can be found on the state climate office website. To begin here, the talk will be of May, a month that produced both less rain and cooler temperatures than normal and included an unusual appearance of snow.
The statewide average temperature of 58.9° was 1.7° below the 1981–2010 normal. This ranked as the 40th coolest May since records commenced in 1895. April and May marked the first time since December 2017–January 2018 that consecutive months had below-average temperatures.
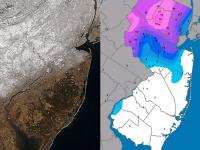
Statewide, May precipitation averaged 2.50”. This was 1.49” below normal and ranked as the 29th driest on record. Figure 1 shows the distribution of precipitation across the state, with most areas receiving under 3.00” and only isolated areas in the northwest over 4.00”. This is the first time a map from the PRISM Climate Group at Oregon State University is being shown in this series of monthly reports, and likely not the last. Later in this report when station specific totals are discussed, it will be quite apparent that CoCoRaHS observations contribute greatly to the PRISM analysis, along with National Weather Service Cooperative station reports. Snowfall averaged 0.1” in the north, with a trace in central and southern locations.

Figure 1. Total May 2020 precipitation across New Jersey based on a PRISM analysis generated using NWS Cooperative and CoCoRaHS observations (Oregon State University).
Temperature
Before the 15th, daily maximum temperatures reached 80° somewhere in the state only once, with this mark not reached consistently until the last week of the month. An 81° maximum was achieved at Basking Ridge (Somerset County), Haworth (Bergen), Sandyston (Sussex), and West Deptford (Gloucester) on the 3rd, with eight other NJWxNet stations reaching 80°. The 15th found Berkeley Township (Ocean) up to 88°, Vineland (Cumberland), West Deptford, and Toms River (Ocean) at 87°, with 52 of the 62 NJWxNet stations also in the 80°s. Harvey Cedars (Ocean) was coolest at 69°. Temperatures backed off on the 16th, though Howell (Monmouth) still made it to 82° and seven other stations from 80°–81°. Cape May Court House (Cape May) and Greenwich (Cumberland) made it to 80° on the 23rd.
The 26th began five consecutive 80° days for NJ, with a state monthly maximum of 89° at the unlikely northwest Sussex County location of Sandyston. Walpack (Sussex) followed with 86°, Stewartsville (Warren) 85°, and 25 stations were in the lower 80°s. Cool ocean waters helped keep the maximum to just 60° at Harvey Cedars on Long Beach Island. The 27th brought an 85° maximum to West Deptford, with 30 stations from 80°–84°. West Deptford again led the way on the 28th at 82°, with nine stations at 80° or 81°. Basking Ridge topped out at 88° on the 29th, with West Deptford and Mansfield (Burlington) at 87°, an impressive 27 sites at 85° or 86°, and 19 locations from 80°–84°. A rather even distribution of maximum temperatures on the 30th found Woodbine (Cape May), Egg Harbor Township (Atlantic), and Hamilton (Mercer) rising to 84°, 44 locations from 80°–83°, and High Point Monument (HPM; Sussex) representing the coolest in the state at 74°.
The temperature story of the month was the cold, in particular a number of stations dipping to or below the freezing point on multiple occasions. An unusual eight May days saw a freeze at one or more NJWxNet locations. As expected, the northwest valley Walpack station led the way with freezes on all eight days, followed by Sandyston (Sussex) on six days and Pequest (Warren) on five. The count began on the 5th and 6th with Walpack down to 31° on both days.
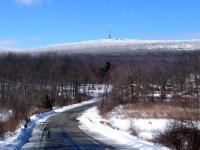
Records suggest that the 8th to 10th may have been the coldest May interval on record for New Jersey, particularly the 9th. As the polar vortex began to invade the Northeast on the 8th, the thermometer fell to 28° at HPM, 29° at High Point (Sussex, approx. 300 feet lower than HPM), and 31° in Walpack and Sandyston. The 9th was as close to a winter-like May day ever to be seen in NJ. In addition to some snow falling (see below), temperatures fell below freezing at 19 NJWxNet stations. HPM dipped to 24°, High Point 25°, and Sandyston 27°, with 16 from 28°–32° (Figure 2). Even coastal stations were chilly, with Lower Alloways Creek Township (Salem) and West Cape May “mildest” at 37°. Perhaps more remarkably, the daytime high at HPM was only 36° and just 37° at High Point. The best any station could do for warmth was 51° at both Sicklerville (Camden) and Cape May Court House. Figure 3 shows a 24-hour time series of temperature and wind at HPM from the morning of the 9th into the 10th. A 50 mph gust occurred during the 6 AM hour on the 9th. Add to that afternoon snow squalls in northern and central NJ and one truly wondered if the calendar was lying. In fact, during this period, the eastern US was the coldest location relative to normal across the globe (Figure 4).

Figure 2. Minimum temperatures on May 9th. Reports are from NJWxNet stations.

Figure 3. Time series of air temperature (top) and wind speed (blue bars) and gusts (black bars) at the NJWxNet High Point Monument station from 8:00AM on May 9th to 8:00AM on May 10th.

Figure 4. One-day average 2 meter temperature anomaly for May 9th (courtesy of Climate Reanalyzer.org).
The cold was slow to depart. As winds subsided, skies cleared, and cold air drainage took control, temperatures on the morning of the 10th fell to 28° at Walpack, Hopewell Township (Mercer), Kingwood (Hunterdon), and Pequest, and from 29°–32° at 15 locations. But that was not all. Another shot of cold air invaded on the 13th, with Walpack down to 24°, Pequest and Sandyston each 27°, and 14 NJWxNet locations from 28°–32°. Atlantic City Marina (Atlantic) and Harvey Cedars were the mild spots at 44°. Walpack fell to 26° on the 14th, with Sandyston 28°, and nine stations from 29°–32°. It warrants mentioning that all but the coldest NJ locations tend to have their last freeze by about April 20th. Speaking of those coldest spots, the freezing mark was reached on the 21st at Walpack down to 28°, Pequest 29°, Sandyston 30°, Basking Ridge 31°, and Hopewell Township 32°. That was it for May freezes, but to spill the beans on the June report, Walpack dropped to 32° on the 1st.
The 21st also delivered a very interesting contrast between high and low temperatures at coastal and inland valley locations. The cold morning temperatures away from the coast transitioned to a mild afternoon (Figure 5). For instance, the morning low at Sandyston of 30° rose to a maximum of 76°, a 46° diurnal temperature range. Meanwhile, Sea Girt (Monmouth) started out at 49° and only rose 5° to a high of 54° (Figure 6).

Figure 5. Minimum (left) and maximum (right) temperatures on May 21st at NJWxNet stations.

Figure 6. Time series of air temperature (blue line) and dewpoint (black line) at the Sandyston (top) and Sea Girt (bottom) NJWxNet stations from 5:00PM on May 20th to 5:00PM on May 21st. Note that the scale of the left axis differs between the two graphs.
So just when did the growing season start in New Jersey this season? The growing season onset is defined as the first day when the low temperature begin to continuously remain above freezing. Also, how long was the winter period between first and last freeze? The differences across the state for each are striking. The last spring freeze at Atlantic City Marina and Harvey Cedars (along with several other NJWxNet stations) was on March 1st, while it appears Walpack’s will be June 1st. That is an impressive 92-day difference in the start of the growing season. Just as notable is the difference in the length of the freeze season, with Walpack’s lasting 242 days (October 4th to June 1st) while both Atlantic City Marina’s and Harvey Cedars’ lasting just 115 days (November 8th to March 1st).
Precipitation and Storms
As mentioned previously, scattered areas in the general northwest portion of NJ received the most May rain. Top totals included 5.21” in Washington Township (Morris), West Milford (Passaic) 5.06”, Bridgewater (Somerset) 5.01” and 4.42”, Blairstown (Warren) 4.82” and 4.58”, Oxford (Warren) 4.67”, and Califon (Hunterdon) 4.61”. It is worth noting that all monthly totals drawn from CoCoRaHS reports and most NWS Cooperative Observing station reports (employed in state and divisional totals and departures) include the heavy rain that fell during the afternoon and evening of April 30th into the early hours of May 1st. Low totals for May included Lakewood (Ocean) with 1.64”, Ewing (Mercer) 1.67”, Berkeley Township 1.70”, Red Bank (Monmouth) 1.73”, Woodland Township (Burlington) 1.73”, and Lacey Township (Ocean) 1.75”.
The April 30th–May 1st event totals are mostly shown in Figure 7, although some morning thundershowers along the coast dropped locally heavy rain after measurements were taken on May 1st. Of the 261 CoCoRaHS reports, Oxford received the most rain at 2.27”, followed by 2.26” in Brigantine (Atlantic), 2.25” at both Washington Township (Morris) and Hackettstown (Warren), and Califon 2.11”. 79 stations caught 1.00”–1.99” and 143 from 0.50”–0.99”. South Harrison (Gloucester) with 0.26” saw the least.

Figure 7. Rainfall from approximately 7AM on April 30th to 7AM on May 1st. Reports are from CoCoRaHS observers.
Rain fell mainly in Cape May County from late on the 3rd to pre-dawn on the 4th. North Wildwood caught 0.85”, five Lower Township gauges received from 0.72” to 0.85”, and Middle Township saw 0.70”.
Light rain fell at times on the 8th, becoming steadier in the evening before ending before dawn. By late evening, the rain mixed with and changed to snow in the higher elevations up north, before briefly ending as snow at lower elevations throughout northern and central areas. Scattered snow squalls and flurries during the daytime hours on the 9th added little to the rain and snow totals, except for up to 0.5” of new snow at higher elevations. Greenwich (Warren) saw the most rain and melted snow at 0.85”, Blairstown 0.84” and 0.81”, and Holland Township (Warren) 0.80”. Snowfall totaled 1.0” at HPM, Jefferson Township (Morris) 0.8”, Sparta (Sussex) 0.5”, and both Roxbury Township (Morris) and Mount Arlington (Morris) had 0.4”. Eight other stations came in with 0.1”–0.3”. This was New Jersey’s first measurable May snowfall since May 9, 1977, when up to 10.0” fell at HPM and 1.0” at Canistear Reservoir (Sussex). On May 10, 1954, Oak Ridge Reservoir (Passaic) received 0.5” for the only official later accumulating event, though flurries later in May have been reported in several other years.
The afternoon of the 11th found fast-moving thunderstorms scattered throughout the state. Rainfall totals were not impressive, amounting to at best 0.22” in both Mount Arlington and West Milford, and 0.21” in Montclair (Essex). However, there were numerous reports of hail up to dime size in diameter at locations from Ocean and Monmouth counties northward. The evening of the 15th saw thunderstorms clip the northwest corner of the state with 0.51” at Montague (Sussex) and 0.38” in Andover Township (Sussex).
Rather persistent dry conditions in portions of south Jersey permitted a May 19th–20th pinelands wildfire in Winslow Township (Camden) and Monroe Township (Gloucester) to spread over 2100 acres before being contained. No structural damage or injuries were reported.
Helping to fully extinguish the fire and reduce concerns for further fires was the wettest event of the month on the 22nd and 23rd (Figure 8). The first shot of rain came into southwest and central areas during the afternoon and evening of the 22nd. Rain resumed from south to north during the pre-dawn hours of the 23rd, continuing into the afternoon. Of the 248 CoCoRaHS reports, 13 stations saw 2.00”–3.01” of rain fall, with 60 sites picking up 1.00”–1.99” and 134 with 0.50”–0.99”. Two Bridgewater locations caught 3.01” and 2.33”, Somerville (Somerset) 2.83”, Middlesex (Middlesex) 2.74”, Monroe Township (Gloucester) 2.20”, South Harrison 2.19”, Piscataway (Middlesex) 2.19”, and Manville (Somerset) 2.19”. On the low end, Montague had only 0.03” and Vernon (Sussex) 0.05”.

Figure 8. Rainfall from approximately 7AM on May 22nd to 7AM on 23rd (left) and from 7AM on May 23rd to 7AM on May 24th (right). Reports are from CoCoRaHS observers.
While not qualifying as a NJ storm, a ridge of high pressure to the north and a cutoff low pressure system to the south generated a persistent onshore easterly flow from the 24th to 27th. This resulted in frequent cloudiness along the coast and in the southern portion of the state, more so than up north. This is illustrated by the NJWxNet solar observations and the NOAA visible satellite image late on the morning of the 24th (Figure 9). Over three times more solar energy was making it to the surface in the northwest than along the central coast, where clouds were thickest.

Figure 9. Solar radiation at 11:07AM (left) and cloud cover from a visible satellite image at 10:56AM (right) on May 24th. Radiation observations from the NJWxNet and satellite image from NOAA.
The final May rain event helped the northwest partly make up for the lack of rain during earlier episodes. Scattered evening and overnight thunderstorms passed through the area on the 29th into the 30th, with Roxbury Township seeing 0.60”, Montague 0.59”, and Wantage (Sussex) and Sparta each catching 0.50”. Lighter totals were confined to central and northern NJ.
The highest barometric pressures of the month occurred on the 17th, ranging from 30.30”–30.40” around the state. The lowest pressures were between 29.10”–29.25” on the 9th. There were six days not previously mentioned when winds at one or more NJWxNet stations gusted to 40 mph or higher. They included the 2nd with HPM at 52 mph, LACT 46 mph, and six stations from 40–43 mph. HPM reached 46 mph and Vineland (Cumberland) 40 mph on the 3rd. HPM hit 40 mph on the 11th, 41 mph on the 15th, and 40 mph on the 16th. HPM reached 51 mph on the 22nd, when Mullica hit 42 mph.
Spring 2020 Overview
The seemingly endless spring was brought about by starting off with the sixth mildest March on record, followed by cooler-than-normal April and May weather. Together, the three months averaged 51.3°. That was 0.6° above normal and ranks as the 27th mildest spring since 1895. The contrast between the early spring warmth and late spring cool was not only noted in air temperatures but also in sea surface temperatures. Figure 10 shows how quickly waters had warmed by late March to above-average levels and how the arrival of cooler-than-average atmospheric conditions from mid-April to mid-May slowed the normal spring warm up to the point of generating negative temperature anomalies. Note in particular the contrast in Delaware Bay, where the cooler water temperatures had an impact on the timing of horseshoe crabs laying their eggs and thus the feeding regiment of migrating birds such as red knots.

Figure 10. Sea surface temperature anomalies along the Mid-Atlantic coast on March 29th and May 19th, 2020. Courtesy of J. Kohut, Rutgers, and the U. Delaware.
Each spring month saw below-normal precipitation, resulting in the 2020 seasonal total of 10.10” being 1.99” below normal. This was the 44th driest of the past 126 springs. The wettest locations were West Milford with 13.62”, Mine Hill (Morris) 13.61, Westfield (Union) 13.21”, Washington Township (Morris) 13.17”, and Bedminster (Somerset) 12.97”. The driest locations were Manchester Township (Ocean) 7.75”, Upper Deerfield 8.60”, and Franklin Township (Gloucester) 8.62”. With the cooler-than-normal conditions and a somewhat even distribution of rainfall during spring, at present there is no immediate drought concern. Early June reservoir levels are in good shape. However, streams flows are lower than average throughout NJ and groundwater levels are below normal in some locations. As always, it is prudent to use water wisely, not knowing what the summer has in store in the rainfall department.
Finally, there is spring snowfall to examine. Remarkably, each month averaged 0.1” in the northern division and a trace in central and southern ones, leading to a statewide average of a trace for each month and for the season. Since traces are not included in official digital records, this obviously means that spring snowfall was at a record minimum for NJ. Five other springs have gone without a measurable statewide total (1903, 1913, 1946, and 1966).


