February Overview
Following on the heels of the 8th mildest January on record, February 2020 entered the books as the 3rd mildest since records began in 1895 (Table 1). The 39.2° average was 5.7° above the 1981–2010 mean. The northern climate division of the state averaged 36.2° (+5.2°; 6th mildest), the south was 41.0° (+6.1°; 3rd mildest), and the coastal division was 41.2° (+5.7°; 3rd mildest). Average minimum temperatures ranked 2nd mildest for the state, while average maximums ranked 8th mildest. To place February 2020 in some perspective, it was just 1.6° below the 1981–2010 March average of 40.8° and only 0.2° below the longer 1895–2019 March average. It was close to the long-term (1981–2010) average February temperatures in Washington, DC, Paducah, KY, and Bristol, TN.
| Rank | Year | Feb. Avg. Temp. |
|---|---|---|
| 1 | 2017 | 40.4° |
| 2 | 2018 | 39.4° |
| 3 | 2020 | 39.2° |
| 4 | 1998 | 39.1° |
| 5 | 2012 | 38.9° |
| 6 | 2002 | 38.4° |
| 7 | 1990 | 38.3° |
| 8 | 1997 | 38.0° |
| 9 | 1976 | 37.7° |
| 9 | 1954 | 37.7° |
Table 1. The ten warmest Februaries across NJ since 1895.
February precipitation (rain and melted snow) came in very close to the 1981–2010 average at 2.82”. This is just 0.02” above average and ranks as the 62nd driest (and 65th wettest) of the past 126 years. Divisional totals ranged from 2.48” (-0.34”, 49th driest) in the north, 2.99” (+0.21”, 60th wettest) in the south, and 3.37” (+0.48”, 51st wettest) at the coast.
Snowflakes were difficult to find in February. The statewide average snowfall of 0.2” was 7.8” below the 1895–2019 mean and ties with 1998 for the least snowy on record. For snow, the state is divided into northern, central, and southern regions. The north total for February was 0.7”, which is 9.3” below average. It is tied with 1953 and 1998 as the 3rd least snowy, behind 0.2” in 2002 and 0.6” in 1968. Three Februaries in the central region and nine in the south reported no February snowfall, while this year was the only one with 0.1” for either region. Season-to-date totals and rankings appear within the winter recap section later in this report.
Precipitation and Storms
The southern coastal counties saw the most February precipitation. Among the approximately 100 CoCoRaHS stations with complete records, Stafford Township (Ocean County) led the way with 4.62”, followed by Brigantine (Atlantic) 4.47”, Linwood (Atlantic) and Lacey Township (Ocean) each with 4.23”, Galloway (Atlantic) and Berkeley Township (Ocean) each 4.18”, and Absecon (Atlantic) 4.12”. Northwest counties saw the least rain and melted snow, with Montague (Sussex) at 2.08”, Sparta (Sussex) and Blairstown (Warren) each 2.23”, Andover (Sussex) 2.27”, Wantage (Sussex) 2.31”, and Hardyston (Sussex) and Moorestown (Burlington) each 2.32”.
Only six CoCoRaHS stations reported 2.0” of more snowfall in February. They include Sparta with 3.4”, Bethlehem (Hunterdon) 3.1”, two Jefferson Township (Morris) locations with 3.0” and 2.8”, Randolph Township (Morris) 2.4”, and Rockaway Township (Morris) 2.0”.
The majority of the month’s snowfall came in the first event beginning the afternoon of the 2nd and lasting into the early hours of the 3rd. Rain and melted snow across NJ totaled no more than 0.30” in Bridgewater (Somerset) and 0.27” at Mt. Olive (Morris). There were seven reports of greater than 2.0” submitted by CoCoRaHS or NWS spotters. They included Bethlehem with 2.7”, Highland Lakes (Sussex) 2.6”, Montague 2.5”, Wantage, Jefferson Township, and Green Pond (Morris) each with 2.1”, and Randolph Township 2.0”.
The next event had several episodes that were separated by several dry hours. It began late on the 5th in the southwest and moved into the rest of the state early on the 6th. Rain resumed during the afternoon of the 6th and continued through the night, especially in the south. The mid to late morning of the 7th saw a short-duration squall line zip from southwest to northeast through NJ in just a few hours. It was accompanied by heavy rain and strong gusty winds. A tornado warning was issued for the extreme southwest but rare February twisters only materialized further to the southwest in Maryland. The afternoon of the 7th saw rapidly falling temperatures and scattered rain, sleet, and snow showers. A rapidly deepening low pressure system associated with the squall line found barometers bottoming out at unusually low levels between 28.80” and 28.90”.
Figure 1 shows 24 hour observations of continuous temperature and dew point, hourly average wind speeds and maximum wind gusts, and barometric pressure at the New Brunswick (Middlesex) NJWxNet station between 8AM on the 7th and 8th. Note that the dew point peaked about an hour before the temperature. The temperature fell over 20 degrees during the afternoon and 30 degrees by the next morning, while the dew point dropped 35 degrees in the afternoon and over 40 degrees by morning. Barometric pressure bottomed out at 28.84” as the squall line hit the station shortly after 11AM, simultaneous with the strongest gust of 47 mph. Pressure subsequently rose quickly to 30.20” by the next morning. This scenario played out similarly across the state. Peak wind gusts at NJWxNet and NWS stations included 73 mph at Cape May Harbor (Cape May), Atlantic City Marina (Atlantic) 69 mph, Mantoloking (Ocean) 67 mph, Sandy Hook (Monmouth) 66 mph, Ewing Township (Mercer) 64 mph, High Point Monument (Sussex) 62 mph, Moorestown 61 mph, and Harvey Cedars (Ocean) and Fortescue (Cumberland) each 60 mph. Nine NJWxNet stations gusted between 50–56 mph and 21 between 40–49 mph. Trees were toppled in many locations, some onto homes, and power lines were brought down, resulting in power outages.
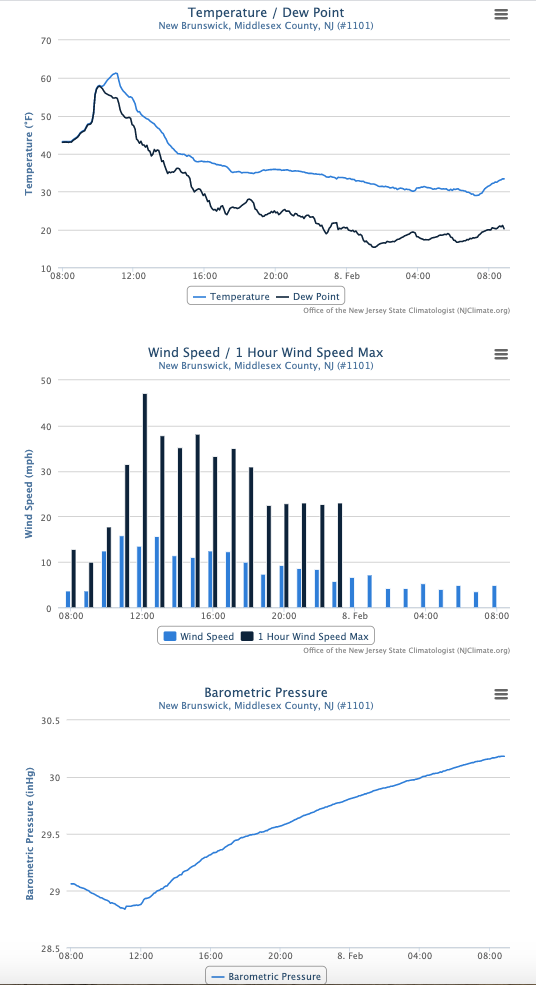
Figure 1. 24-hour time series of weather variables at the New Brunswick NJWxNet station between 8AM on February 7th and 8AM on the 8th.
The southeast received over 1.00” from this multiday event, with four Lower Township (Cape May) stations coming in with 1.76”, 1.71”, 1.64”, and 1.60”, Wildwood Crest (Cape May) catching 1.70”, and Sea Isle City (Cape May) 1.59”. Some 62 of the 216 CoCoRaHS stations reporting came in with 1.00”–1.76”, with many others around NJ receiving 0.50”–0.99”.
Light to moderate rain returned during the afternoon of the 10th, continuing until mid-afternoon on the 11th. Of the 214 CoCoRaHS observations, 179 were between 0.50”–1.13”, led by 1.14” in Millville (Cumberland), Estell Manor (Atlantic) 1.09”, Weymouth (Atlantic) 1.07”, and both Hamilton (Atlantic) and Pittsgrove (Salem) 1.02”.
A mix of snow, sleet, and rain began during the evening of the 12th before turning to mostly rain into the morning of the 13th. A few tenths of an inch of snow and sleet was measured in the northern Highlands, while precipitation topped out at 0.80” in Bedminster (Somerset), Bethlehem Township 0.78”, and Phillipsburg (Warren) 0.77”. Of the 206 CoCoRaHS reports, 86 came in between 0.50”–0.80”, with the most observed in central sections and the least in the far south.
The next 12 days were essentially precipitation-free throughout the state. Toward the end of this period on the 23rd, an 80-acre fire broke out in Worthington State Forest within the Delaware Water Gap (Warren). The smoky conditions slowed traffic along nearby Interstate 80, however, no injuries were reported nor were any structures damaged. In the southern Pine Barrens, controlled burns on the 22nd and 23rd produced considerable smoke that lofted eastward toward the coast and further offshore. The smoke plumes were clearly seen in visible satellite images and on weather radar images (Figure 2).
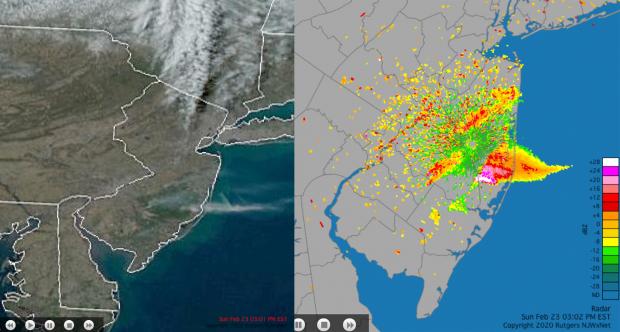
Figure 2. NOAA visible satellite image (left) and NWS radar image (clear-air mode; right) at approximately 3PM on February 23, 2020. Smoke from controlled burns in the south Jersey Pine Barrens is seen blowing to the east and out to sea on both images. Some clouds are found to the north on the satellite image (no smoke from the Water Gap fire is visible) and some random noise not associated with the controlled burns is seen in the radar image, mainly to the northwest of the Pine Barrens.
Light rain on the 25th into the 26th began to break the dry spell, though only a tenth or two was deposited in the northwest and at most 0.40” in the Cape May communities of Middle Township and Lower Township.
More substantial rain moved into the state from the south during the evening of the 26th, ending in the pre-dawn hours of the 27th. Totals exceeded 1.00” at 14 coastal locations, including 1.60” in Berkeley Township, Toms River (Ocean) 1.59” and 1.53” at two stations, Manasquan (Monmouth) 1.40”, Pine Beach (Ocean) 1.38”, and Brick (Ocean) 1.34” (Figure 3). Another 40 stations saw 0.50”–0.99”. A “hole” in the precipitation coverage led to just 0.10” totals in western Cumberland County.
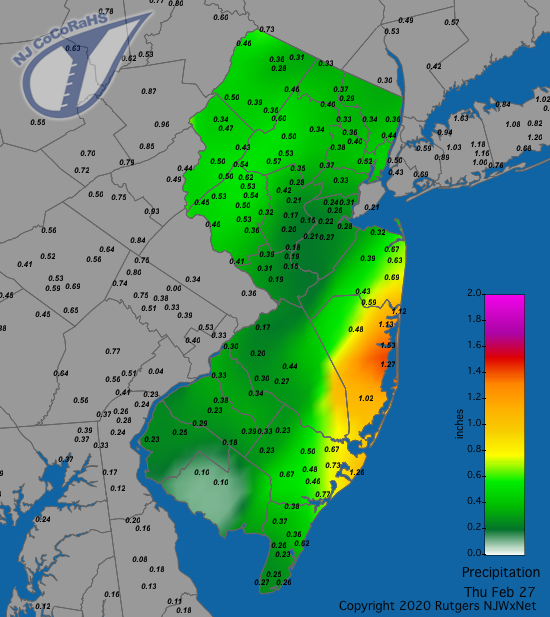
Figure 3. Rainfall from approximately 7AM on February 26th to 7AM on February 27th showing a wide distribution of totals at CoCoRaHS station in southern NJ and more uniform totals in the north.
The aforementioned storm on the 7th brought the lowest barometric pressure of the month. The highest was on the 15th with observations between 30.60”–30.70”. In addition to the strong wind gusts on the 7th, ten other February days found one or more NJWxNet locations gusting to 40 mph or greater. As usual, High Point Monument (HPM) was often the windiest location, leading the pack on eight of the ten days. This station saw the only 40 mph gusts in NJ on the 3rd (47 mph), 5th (40 mph), 8th (50 mph), 12th (42 mph), 14th (44 mph), and 19th (49 mph). Lower Alloways Creek Township (LACT; Salem) was alone at 42 mph on the 13th. LACT shared honors with HPM on the 28th, with the former up to 43 mph and latter at 48 mph. The 27th was the second windiest day of the month, with HPM up to 62 mph, LACT 51 mph, Sea Girt (Monmouth) and Fortescue each at 49 mph, and 17 other stations between 40–48 mph.
Temperature
Six February days saw maximum temperatures exceed 60°at NJWxNet stations. Just a day after snow accumulated in north Jersey, the 3rd brought highs of 64° to Egg Harbor Township (Atlantic), Greenwich (Cumberland), and Vineland (Cumberland). Twenty other locations topped out between 60°–63°. Vineland reached the state monthly high of 69° on the 4th, with Egg Harbor Township at 68°, 13 locations between 65°–67°, and 28 more from 60°–64°. HPM was coolest at 53°. In front of the squall line on the morning of the 7th Silas Little (Burlington) and Hammonton (Atlantic) reached 63° and 34 stations rose to 60°–62°. The mild air failed to make it to the northwest, where High Point got to 42°, and HPM and Walpack (Sussex) each at 43°.
Woodbine (Cape May) hit 61° and Cape May Court House (Cape May) 60° on the 13th. Warm conditions prevailed in the south on the 18th with Piney Hollow (Gloucester) up to 65°, seven stations at 64°, and 19 between 60°–63°. Meanwhile HPM and High Point (Sussex) reached just 39°. This broad range of afternoon temperatures across NJ on the 18th is evident in Figure 4. Widespread 60°s returned on the 24th, when Berkeley Township, Howell (Monmouth), Basking Ridge (Somerset), and Hillsborough Township (Somerset) topped out at 64° and 39 other stations were between 60°–63°. Coastal Harvey Cedars was coolest at 49°.
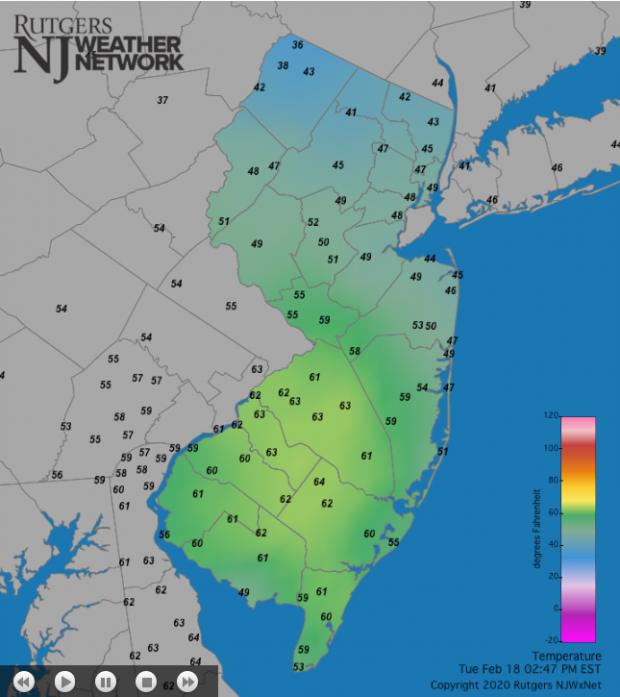
Figure 4. Temperatures across NJ and surrounding states at 2:45PM on February 18th. Observations range from 64° at Hammonton in the south to 36° at High Point in the northwest. A 34° reading at High Point Monument is not shown due to its proximity to the slightly lower elevation High Point station.
Seven February days saw minimum temperatures bottom out at 15° or colder somewhere in the state. Both high elevation HPM and the northwest valley Walpack station were part of the sub-15° group on five days each and together covered all seven days. It was not until the 14th that the first sub-15° reading occurred. HPM fell to 4°, High Point 5°, Sandyston (Sussex) and Walpack each at 8°, and 12 locations from 10°–15°. Atlantic City Marina was least cold at 23°. The 15th was the coldest morning of the winter, at least through the end of February. Walpack, HPM, and High Point all dropped to 1°, Sandyston 2°, Pequest (Warren) 4°, Charlotteburg (Passaic) and Hopewell Township (Mercer) 5°, and 15 stations were between 7°–10°. Harvey Cedars was least cold at 18°.
HPM was 13° and High Point 14° on the 20th. Walpack fell to 6°, HPM 8°, and eight stations from 10°–15° on the 21st. The 22nd saw Walpack down to 12°, Sandyston 13°, and Berkeley Township 14°. Walpack reached 12° and Berkeley Township, Hopewell Township, and Pequest each fell to 15° on the 23rd. HPM finished the month with 15° on the 29th.
The atmosphere was quite dry, with skies clear and general calm from the 22nd–24th. This resulted in some 40 degree or greater diurnal temperature ranges at some inland locations. Walpack rose from a morning low of 12° to an afternoon maximum of 53° on the 22nd. Not only was this a 41° range but this location had the state’s high and low temperatures that day. With a southerly flow off of Delaware Bay, Fortescue only had a 13-degree diurnal range on the 22nd, from a low of 33° to a high of 46°. The 23rd found eight stations with a diurnal range between 40 and 44 degrees, led by Walpack (12° minimum/56° maximum) and Berkeley Township in the Pine Barrens (15°/58°). Eleven stations had a range between 40 and 46 degrees on the 24th, again led by Walpack (16°/62°), with Berkeley Township starting at 20° and topping out at a state maximum (with three other stations) of 64°. The morning of the 24th provided a textbook example of a temperature inversion throughout the state, with cold air spilling off the higher elevations into nearby valleys (Figure 5). Urban heat island and maritime moderating influences along coastal areas can also be recognized.
For the second time in February, the 25th saw Walpack have the state’s daily highest and lowest temperatures, joined this time by Sandyston. Each had minimums of 34° and maximums of 55°. The 25th was one of only two February days that failed to see any NJWxNet station drop below freezing, the other being the 26th with HPM coolest at 35°. HPM also had the only freezing low (31°) on the 11th.
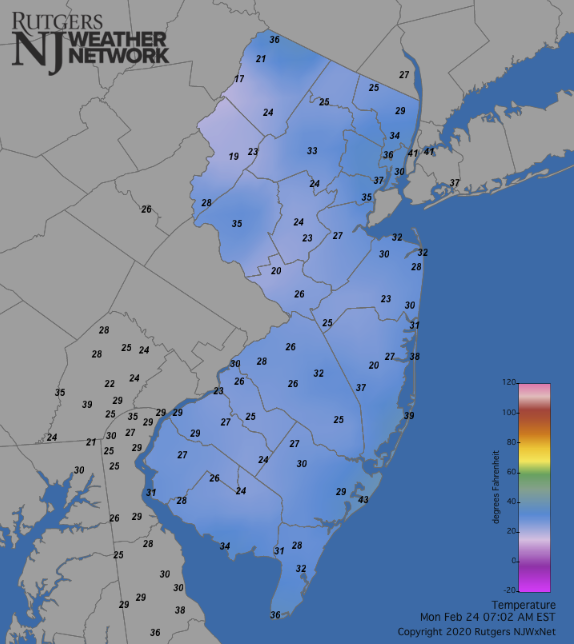
Figure 5. Temperatures across NJ and surrounding states at 7:00AM on February 24th.
Winter Recap
The statewide average temperature for this past December to February was 37.7°. This is 4.5° above the 1981–2010 mean and ranks as the 6th mildest over the past 125 winters. Monthly rankings of 28th (December), 8th (January), and 3rd (February) conspired to achieve this ranking. Five of the seven warmest winters have occurred in the past 20 years.
| Rank | Year | Winter Avg. Temp. |
|---|---|---|
| 1 | 2001/02 | 38.8° |
| 2 | 2015/16 | 38.5° |
| 3 | 2011/12 | 38.3° |
| 4 | 1997/98 | 38.0° |
| 5 | 1931/32 | 37.9° |
| 6 | 2019/20 | 37.7° |
| 7 | 2016/17 | 37.6° |
| 8 | 1998/99 | 36.2° |
| 9 | 1990/91 | 36.1° |
| 10 | 1948/49 | 36.0° |
Table 2. The ten warmest winters (December–February) across NJ since 1895/96. The coldest was 23.4° in 1917/18.
Winter precipitation (rain and melted snow) averaged 10.64” across the state. This is 0.59” above average and is the 49th wettest. A positive December precipitation anomaly slightly outpaced the January negative departure, with February almost exactly average. Northern NJ reservoir levels are above average, minimizing any water resource concerns as we head toward summer.
Season-to-date state snowfall is 4.7”. This is 16.3” below average through February and is the 4th least observed by this point of the season dating back to the 1895/96 snow season. Only the season-through-February values of 2.7” (1918/19), 3.3” (1991/92), and 3.8” (1972/73) were lower. The snow drought is most pronounced in south Jersey (all counties south of and including Burlington and Ocean), where only 0.7” (-15.8”) has accumulated. This is the least-snowy season through February, eclipsing the previous low of 0.9” in 1972/73. Central counties have had 5.5” (-17.7”) and are 7th least snowy, the record being 2.0” in 1918/19. The northern counties (Warren-Morris-Essex northward) have averaged 11.5” (-15.9”), the 14th least-snowy season to date. The record low remains 4.3” in 1991/92.


