December Overview
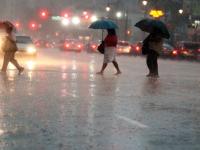
It was a wet December, of this there is no doubt. In fact, it was New Jersey’s wettest 12th month on record, dating back to 1895. On multiple occasions, rainfall arrived in multiple-inch increments, leading to episodes of minor to major stream and river flooding. Though hardly maliciously, Mother Nature certainly left the tap flowing far too long and often!
Monthly rainfall (with a little melted snowfall added to the mix in some locations) averaged 8.20” across the state (Figure 1). This was 3.93” above the 1991–2020 normal and was 0.33” above the previous wettest December in 1996 (Table 1). Precipitation averaged 8.51” (+4.26”, 3rd wettest) in the northern climate division (Hunterdon-Somerset-Union northward), 8.02” (+3.74”, 2nd wettest) over the southern division (Mercer-Middlesex-Monmouth mostly southward), and 7.88” (+3.52”, 2nd wettest) in the coastal division (generally east of the Garden State Parkway from Monmouth to Cape May).
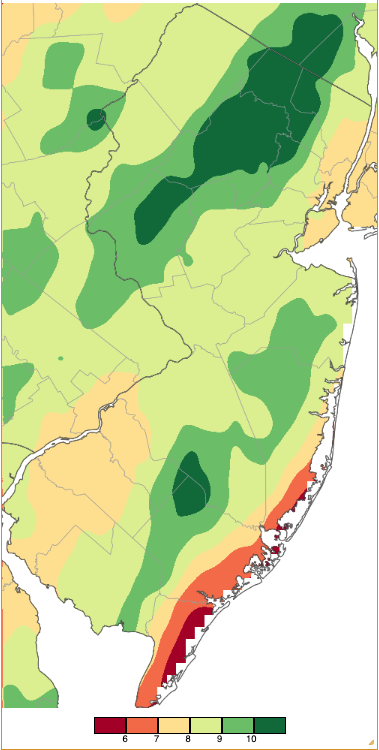
Figure 1. December 2023 precipitation across New Jersey based on a PRISM (Oregon State University) analysis generated using NWS Cooperative, CoCoRaHS, NJWxNet, and other professional weather station observations from approximately 7 AM on November 30th to 7 AM on December 31st. Note the scale in inches at the bottom of the map. Totals range from 5.00”–5.99” (dark red) to 10.00”–10.99” (dark green).
| Rank | Year | December Avg. Precip. |
|---|---|---|
| 1 | 2023 | 8.20” |
| 2 | 1996 | 7.87” |
| 3 | 2009 | 7.71” |
| 4 | 1973 | 7.45” |
| 5 | 1901 | 7.41” |
| 6 | 1902 | 7.31” |
| 7 | 1983 | 7.26” |
| 8 | 1969 | 7.16” |
| 9 | 1957 | 6.49” |
| 10 | 2008 | 6.44” |
Table 1. The 10 wettest Decembers across NJ since 1895.
While there was measurable snowfall at higher northwest New Jersey elevations on one occasion, the statewide snowfall average was 0.0” for the month. This is the 7th time since 1895 with such a statewide average (also in 1943, 1953, 1965, 1999, 2006, and 2011). The northern snow region (Warren-Morris-Essex counties and north) averaged 0.1”, the 3rd time it has hit that mark in December, with three years at 0.0”. The central region (Hunterdon-Mercer-Somerset-Union-Middlesex-Monmouth) averaged 0.0” for the 12th time in December, and the 0.0” in the south (Burlington-Ocean counties south) equaled 23 previous years.
December was a mild month, with the statewide average of 41.2° coming in at 4.6° above normal. This ranked as the 3rd mildest on record (Table 2), tied with 2021. The northern division averaged 39.3° (+5.2”, 3rd mildest), southern 42.3° (+4.2°, 5th mildest), and coastal 43.2° (+4.1°, 7th mildest). The statewide average maximum of 49.3° was 4.3° above normal, ranking as the 8th warmest. The NJ average minimum of 33.2° was 5.0° above normal, ranking 2nd mildest. The average minimum was 1° milder than this past November. This is only the 5th time this has occurred since 1895, all the others being since 1996, with the other four just 0.1° to 0.4° milder than November minimums.
| Rank | Year | December Avg. Temp. |
|---|---|---|
| 1 | 2015 | 48.0° |
| 2 | 2006 | 41.7° |
| 3 | 2023 | 41.2° |
| 3 | 2021 | 41.2° |
| 5 | 2001 | 41.1° |
| 6 | 2012 | 40.6° |
| 7 | 2011 | 40.5° |
| 8 | 1984 | 40.2° |
| 9 | 1998 | 40.0° |
| 10 | 1982 | 39.7° |
Table 1. The ten mildest Decembers across NJ since 1895.
Precipitation and Storms
The wettest NJ locations received over 2.5 times their normal December precipitation while the “driest” spots were about an inch above average. Topping the list of CoCoRaHS stations was West Milford (Passaic County) with 11.77”. This was followed by Mine Hill Township (Morris) at 11.71”, Oakland (Bergen) 11.49”, Randolph Township (Morris) 11.33”, Denville (Morris) 11.19” and 11.01” (two sites), and Chatham (Morris) 11.07”. Forty-one stations caught more than 10.00”. On the low end, Brigantine (Atlantic) received 5.45”, followed by 5.53” in Wildwood Crest (Cape May), Ocean City (Cape May) 5.56”, Barnegat Light (Ocean) 6.03”, Galloway Township (Atlantic) 6.15”, and Little Egg Harbor Township (Ocean) 6.21”. Accumulating snowfall only occurred in one event that will be discussed below.
The first of four storms that brought at least an inch of rain to some locations arrived in the pre-dawn hours of the 3rd, tapering to drizzle that afternoon. Woodbridge (Middlesex) led the way with 1.07”, followed by Denville 1.05”, Princeton (Mercer) 1.01”, and 194 of 240 CoCoRaHS stations from 0.50”–0.99”.
Next up was a storm that occurred from the afternoon of the 10th into the morning of the 11th (Figure 2). This soaker brought as much as 3.61” to Bradley Beach (Monmouth), Millville (Cumberland) 3.60”, Ocean Township (Monmouth) 3.47”, Manchester Township (Ocean) 3.47”, Vineland (Cumberland) 3.46”, and Hamilton (Atlantic) 3.45”. Twenty-six of 275 CoCoRaHS reports were above 3.00”, 127 from 2.00”–2.99”, and 121 from 1.26”–1.99”, the low value of 1.26” seen in Westfield (Union). It was cold enough in the northwest hills to bring snow levels down to about 1,000 feet. As one might suspect, the highest point in NJ, High Point Monument (Sussex), saw the most snow with 5.1” (Figure 3), followed by the High Point Ranger Station (Sussex) with 3.5”, Green Pond (Morris) 1.7”, and Holland Township (Hunterdon) 0.9”. Seven reports were submitted with over an inch and 12 from 0.1”–0.9”. Winds gusted to 45 mph at Harvey Cedars (Ocean) on the 10th, and on the 11th to 44 mph at both High Point Monument and Vernon Township (Sussex) and 42 mph in Harvey Cedars.
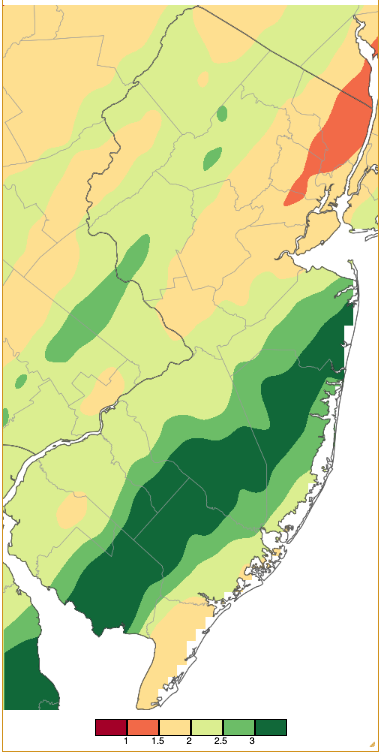
Figure 2. Precipitation across New Jersey from 7 AM on December 10th through 7 AM December 12th based on a PRISM (Oregon State University) analysis generated using NWS Cooperative, CoCoRaHS, NJWxNet, and other professional weather station observations. Note the scale in inches at the bottom of the map. Totals range from 0.50”–0.99” (dark red) to 3.00”–3.49” (dark green).
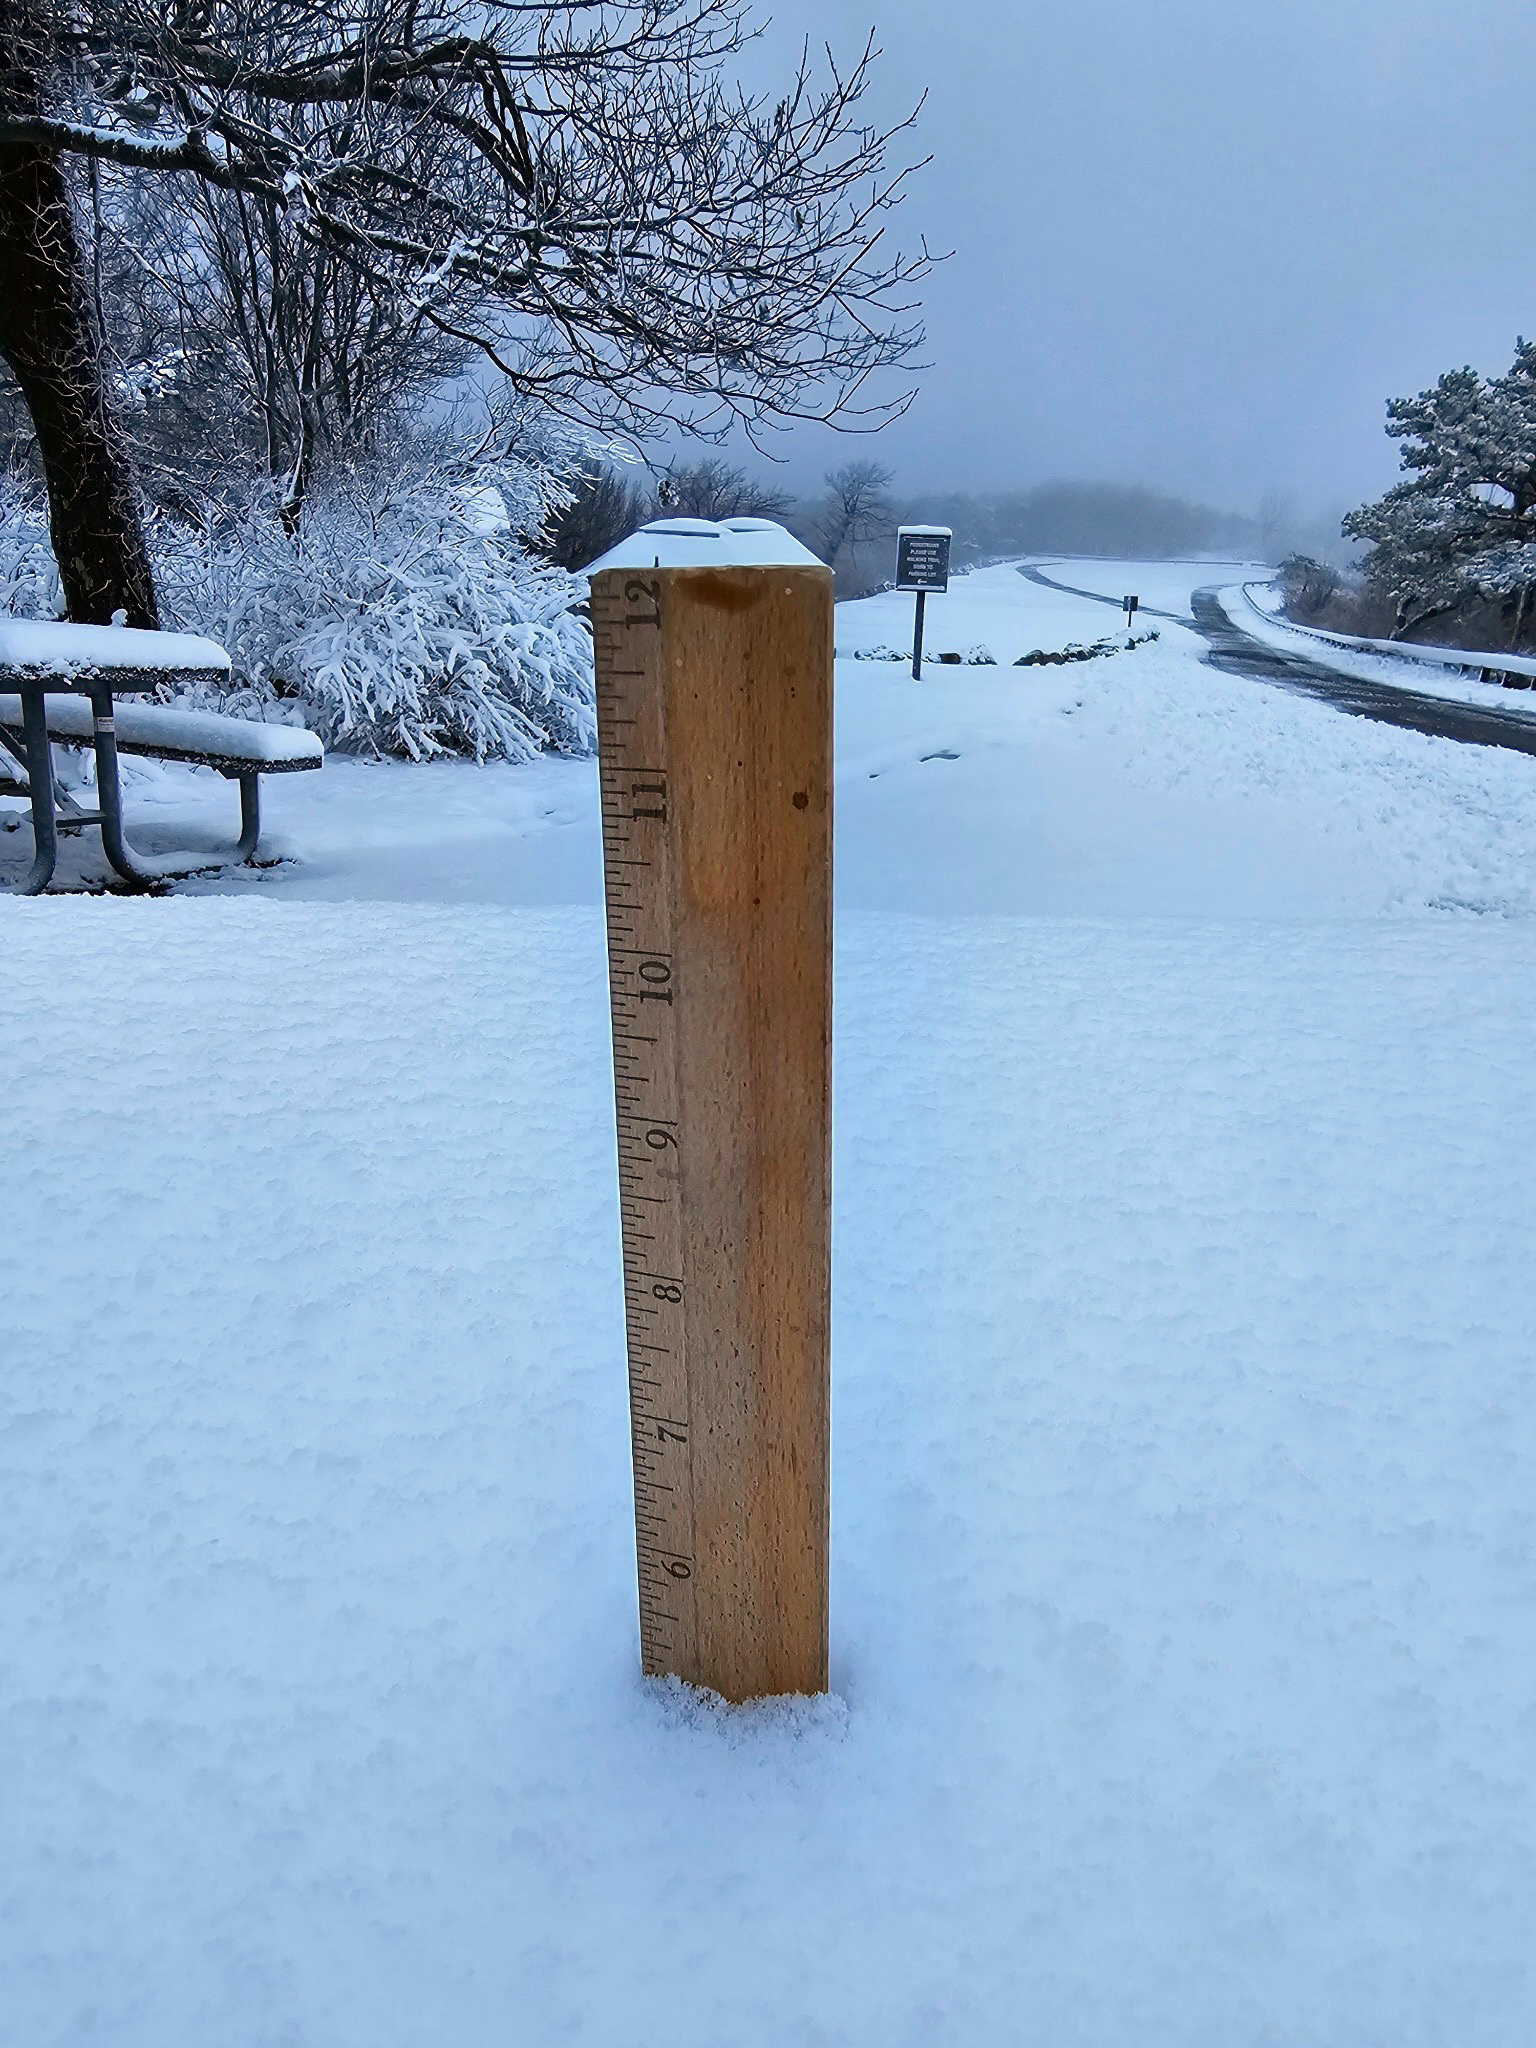
Figure 3. The 5.1” snowfall at High Point Monument on the morning of December 11th (courtesy of Shawn Viggiano).
The strongest and most impactful statewide storm of 2023 arrived in south Jersey during the morning of the 17th, with light rain moving northward and becoming heavier later in the day and into the early hours of the 18th. Rain fell of varying intensity during the morning of the 18th before tapering off early in the afternoon up north.
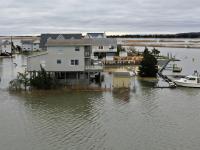
Before examining rainfall and river flooding it is worth noting the strength of the storm as measured by its very low pressure in the 29.00”–29.10” range, the lowest of 2023. This came on the heels of the highest pressure of 2023 on the 14th when the barometer topped out at 30.65”–30.75”. This pressure gradient helped generated strong winds across the state, particularly near the coast. On the 17th, a 49-mph gust was observed in Lower Alloways Creek Township (Salem) and a 40-mph gust at Dennis Township (Cape May). The 18th was one of the windiest days across NJ since Sandy (2012). Twenty-eight Rutgers NJ Weather Network stations recorded gusts of 40 mph or higher. Those over 50 mph included Lower Alloways Creek Township 56 mph, Fort Dix (Burlington) 54 mph, Harvey Cedars 53 mph, Lyndhurst (Bergen) 53 mph, Sea Girt (Monmouth) 53 mph, Fortescue (Cumberland) 52 mph, High Point Monument 51 mph, Little Egg Harbor Township 50 mph, and Seaside Heights (Ocean) 50 mph. Eight other stations gusted from 45–49 mph and 11 from 40–44 mph. It took until the 19th for winds to fully calm, but not before Lower Alloways Creek Township reached 41 mph and High Point Monument 40 mph. The winds contributed to tides up and down the coast rising to minor to moderate flood levels, particularly on the morning of the 18th as shown in Figure 4. Waves atop the high waters were also unusually large with reports of breakers exceeding 10 feet.
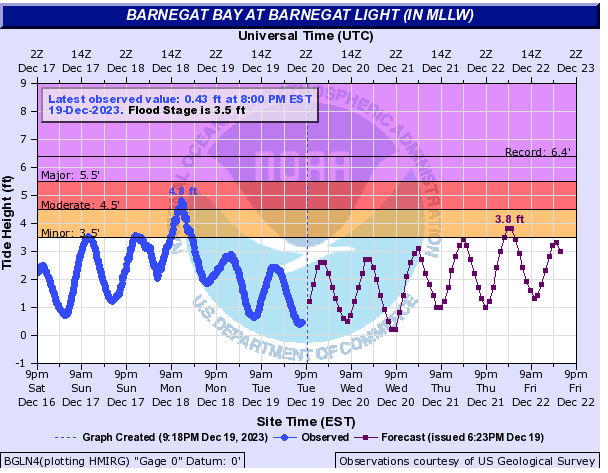
Figure 4. Tide heights at the Barnegat Bay at Barnegat Light (Ocean) tide gage from 9 PM on December 16th to 9 PM on December 19th (blue line) and projected heights onward to December 22nd (purple line). Moderate flood level was achieved at high tide during the morning of the 18th (courtesy of NOAA National Ocean Service).
As for the rain, totals reached levels rarely witnessed during the cooler portion of the year, a period when the ocean and atmosphere are more “challenged” to provide and contain enough precipitable water to generate totals that in some locations exceeded 5.00”. Among the heaviest totals were Oakland 5.68”, West Milford 5.56”, Roxbury Township (Morris) 5.58”, Wayne (Passaic) 5.20” and 5.30”, Verona (Essex) 5.27”, and Pompton Lakes (Passaic) 5.18”. Of 280 reports, six other stations exceeded 5.00”, 31 from 4.00”–4.99”, 170 from 3.00”–3.99”, 59 from 2.00”–2.99”, and 8 between 1.56” (Barnegat Light) and 1.99” (Figure 5). An examination of excessive NJ rainfall events suggests that this storm may rank close to the 50th largest average statewide total of any time of the year since 1895. It certainly rivals the two largest winter (December–February) storms that occurred from December 10–12, 2008, and January 31–February 3, 1915.
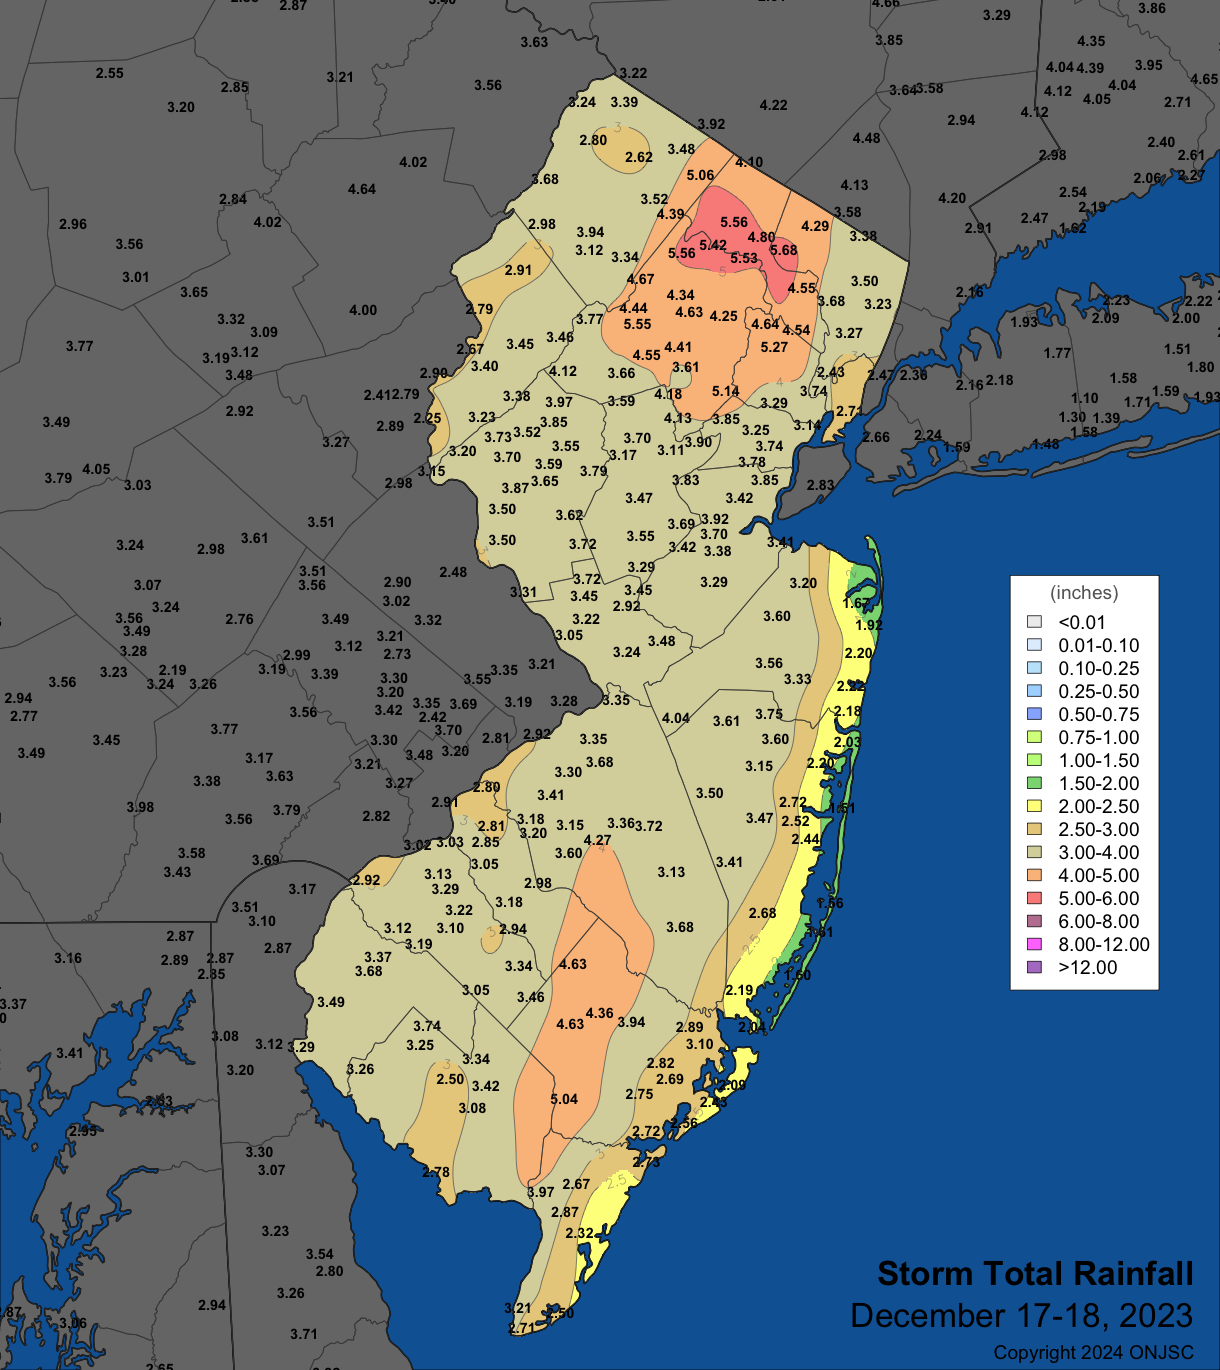
Figure 5. Precipitation across New Jersey on December 17th through December 18th based on data collected from NWS Cooperative, CoCoRaHS, and NJWxNet weather station observations.
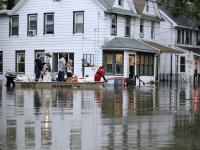
As a result of the heavy rain falling upon soils that remained saturated from late-November and early-December rains, flooding ensued, first the flash variety on streams and roads. Hours to days later, flood levels on rivers rose to the major category, particularly within the Passaic and Raritan basins. The main stem of the Raritan River in Bound Brook (Somerset) crested at 33.72 feet close to 10 PM on the 18th (Figure 6). This was 0.72 feet above major flood stage and ranks as the 9th highest crest in over a century of records. It was the highest level since September 2, 2021 (Ida), when the crest was near the record maximum of 42.13 feet on September 17, 1999 (Floyd). The main stem of the Passaic River at Little Falls (Passaic) crested at 10.29 feet close to 5 AM on the 20th (Figure 7). This was 1.29 feet above major flood stage and, like the Raritan, ranks as the 9th highest crest in over a century. It was the highest level since September 9, 2011 (Irene and Lee), but well below the record maximum of 17.50 feet on October 10, 1903.
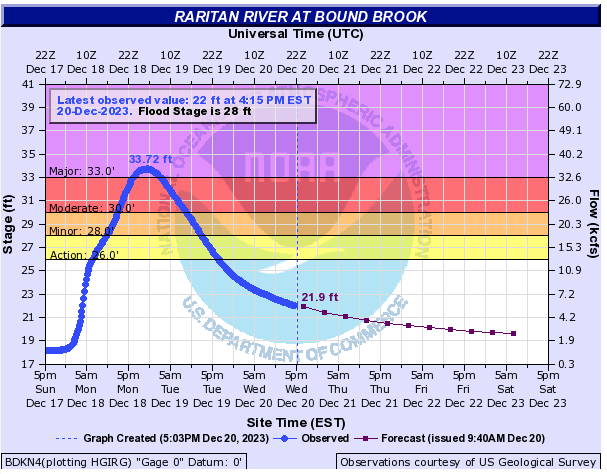
Figure 6. Discharge of the Raritan River at Bound Brook from 5 PM on December 17th to 5 PM on December 20th (blue line). Forecast for the declining discharge onward into the 23rd also shown (purple line). This gauge is downstream from the confluence of the Raritan and Millstone rivers. Note the linear stage scale (left axis) and non-linear discharge (flow) scale (right axis; courtesy of NOAA).
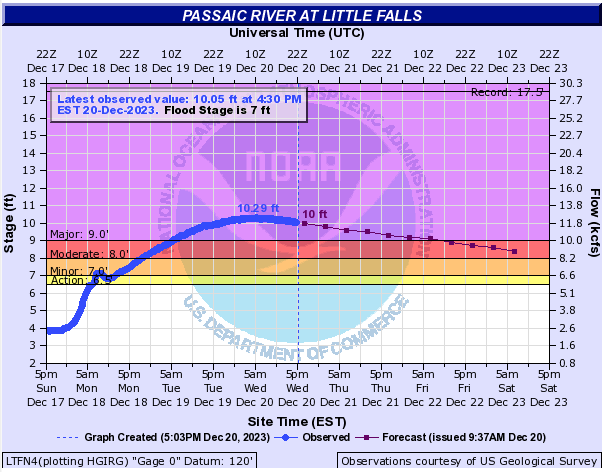
Figure 7. Discharge of the Passaic River at Little Falls from 5 PM on December 17th to 5 PM on December 20th (blue line). Forecast for the declining discharge onward into the 23rd also shown (purple line). This gauge is upstream from the Great Falls at Paterson (Passaic). Note the linear stage scale (left axis) and non-linear discharge (flow) scale (right axis; courtesy of NOAA).
As if NJ was not already wet enough, yet another storm invaded the state during the morning of the 27th, persisting into the morning of the 28th. This delivered the heaviest soaking to the north, with lesser amounts in the south (Figure 8). Sixteen CoCoRaHS reports exceeded 3.00”, topped by 3.45” at Bernards Township (Somerset), Washington Township (Warren) 3.44”, White Township (Warren) 3.26”, Lebanon Township (Hunterdon) 3.20” and 3.05”, and Randolph Township 3.16”. Totals of 2.00”–2.99” were measured at 106 stations, with 138 picking up 1.00”–1.99”. Middle Township (Cape May) saw the least, with just 0.47”.
Fortunately, winds were not as strong as in the previous two storms, which limited coastal flooding. Inland, minor to borderline moderate flooding occurred within the Raritan and Passaic basins, certainly due in part to the soakings they had received from the prior storms. Road closures again occurred in multiple communities.
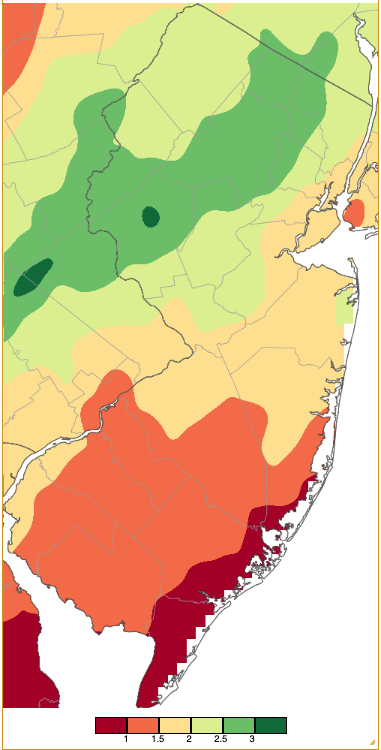
Figure 8. Precipitation across New Jersey from 7 AM on December 27th through 7 AM December 29th based on a PRISM (Oregon State University) analysis generated using NWS Cooperative, CoCoRaHS, NJWxNet, and other professional weather station observations. Note the scale in inches at the bottom of the map is the same as in Figure 2. Totals range from 0.50”–0.99” (dark red) to 3.00”–3.49” (dark green).
No other December days than the five mentioned previously had reported gusts of 40 mph or higher, and the month’s highest and lowest barometric pressures were also mentioned above.
Temperature
There were eight December days when one or more of the 67 Rutgers NJ Weather Network station had a high temperature at or above 60°. The first occurred on the 2nd when Little Falls (Passaic) reached 61° and three other stations 60°. A week later, Howell (Monmouth) and Oswego Lake (Burlington) rose to 62° and 11 stations were 60° or 61°. The 10th was the warmest December day, with Woodbine (Cape May) up to 66°, Dennis Township and East Brunswick (Middlesex) both at 64°, and 47 stations from 60°–63° (Figure 9). High Point Monument was coolest at 54°.
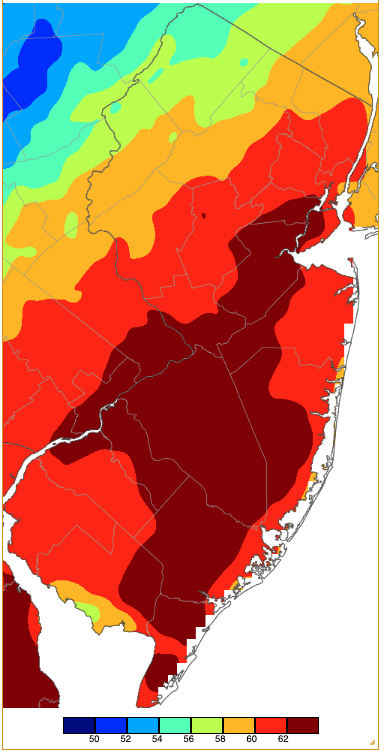
Figure 9. Maximum temperatures on December 10th based on a PRISM (Oregon State University) analysis generated using NWS, NJWxNet, and other professional weather stations. Note the 2° scale beneath the map.
Toms River (Ocean) made it to 60° on the 11th while up north, High Point Monument only made it to 36°. The 15th found six stations up to 60°, while Vineland reached 61° and Greenwich (Cumberland) 60° on the 16th. Greenwich rose to 62° on the 17th when 16 stations had highs of 60° or 61°. The storm on the 18th delivered mild air to NJ when, despite cloud cover, Cream Ridge (Monmouth), East Brunswick, Fort Dix, and New Brunswick (Middlesex) all reached 64°, while 53 stations made it to 60°–63°. High Point Monument was coolest at 56°. The close statewide range demonstrated the ability of the strong winds to distribute the warmth rather evenly.
On the cold side of the ledger, there were eight December days when lows fell to 20° or lower at one or more NJWxNet locations. This is fewer than the eleven November 2023 days when this mark was achieved. The first such day waited until the 13th when Pequest (Warren) fell to 20°, while West Cape May (Cape May) was mildest at 39°. Walpack (Sussex) reached 18° on the 14th, with Hopewell Township (Mercer) at 19° and 20 stations at 20°. Pequest started the 15th at 20°, destined to rise with five other stations to a state maximum of 60° that afternoon.
A five-day stretch of colder days arrived on the 19th with High Point Monument at 20°. The Monument and Walpack each dropped to 19° on the 20th. The Monument was 17° and four stations 18°–19° on the 21st. The 22nd was the coldest morning of the season thus far with High Point Monument down to 13°, High Point (Sussex) 14°, and 14 NJWxNet stations 15°–20° (Figure 10). Fortescue and Lower Alloways Creek Township were least cold at 32°. The 23rd found Walpack and Sandyston (Sussex) at 19°. From then on, many locations failed to drop below freezing through the end of the month, a most unusual circumstance. Throughout December, there were six days when none of the NJWxNet stations dropped to 32° or colder, including the 2nd, 3rd, 10th, 17th, 27th, and 28th.
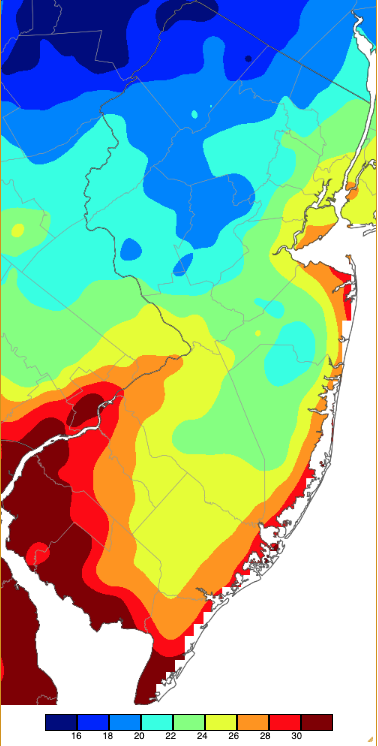
Figure 10. Minimum temperatures on December 22nd based on a PRISM (Oregon State University) analysis generated using NWS, NJWxNet, and other professional weather stations.
Annual Overview
Click here for our annual ranking of the top 10 weather/climate occurrences of 2023. Below, we recap temperature and precipitation conditions across NJ over the past year.
The statewide average 2023 temperature of 55.3° was 1.7° above the 1991–2020 average and ranks as the 3rd warmest since 1895 (Table 1). This century has included nine of the ten warmest years of the past 129, with eight since 2010. The 2023 average is 3.4° above the average from 1895–2023. Eight months averaged above normal. This included the warmest January, the 3rd warmest February, April, and December, and the 2nd warmest winter (December 2022–February 2023). The average annual maximum of 65.5° was 2.0° above average (1991–2020), ranking 2nd warmest. The average minimum of 45.2° was 1.6° above average, ranking 4th warmest. The northern climate division averaged 53.3° (+1.8°, 4th warmest), the southern division 56.6° (+1.8°, 3rd warmest), and coastal division 56.8° (+1.9°, 3rd warmest).
| Rank | Year | Annual Avg. Temp. |
|---|---|---|
| 1 | 2012 | 55.9° |
| 2 | 2020 | 55.5° |
| 3 | 2023 | 55.3° |
| 4 | 1998 | 55.2° |
| 5 | 2021 | 55.1° |
| 6 | 2016 | 55.0° |
| 6 | 2006 | 55.0° |
| 8 | 2011 | 54.9° |
| 9 | 2010 | 54.7° |
| 10 | 2017 | 54.6° |
Table 1. The ten mildest years across NJ since 1895.
The highest daily maximum temperatures of the year at stations throughout NJ and adjacent areas were used to generate Figure 11. The map does not depict temperatures occurring on a single day, rather it displays the highest temperatures achieved on the hottest day during the year for a given location, based on dozens of stations. It shows that the entire state made it to 90° or higher at least once during the year except for the highest elevation stations in the northwest. The highest temperature in NJ in 2023 was 100° at Fort Dix (Burlington) on September 7th.
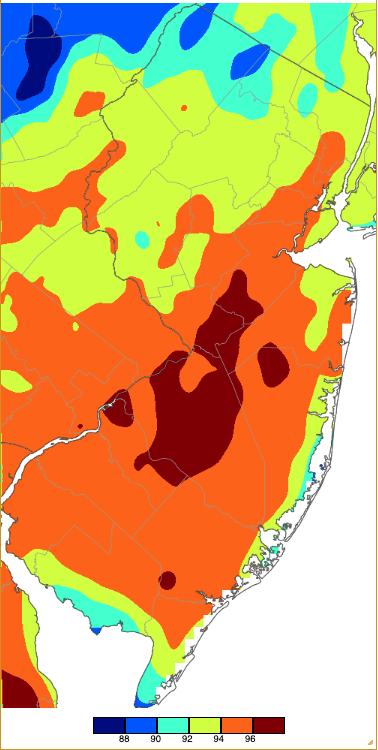
Figure 11. Annual maximum temperatures across NJ during 2023 based on a PRISM (Oregon State University) analysis generated using NWS, NJWxNet, and other professional weather stations.
The lowest daily maximum temperatures of the year are mapped in Figure 12. Areas in the northwest saw minimum maximums in the teens, while rising in a general latitudinal pattern where the far south did not experience a full subfreezing day.
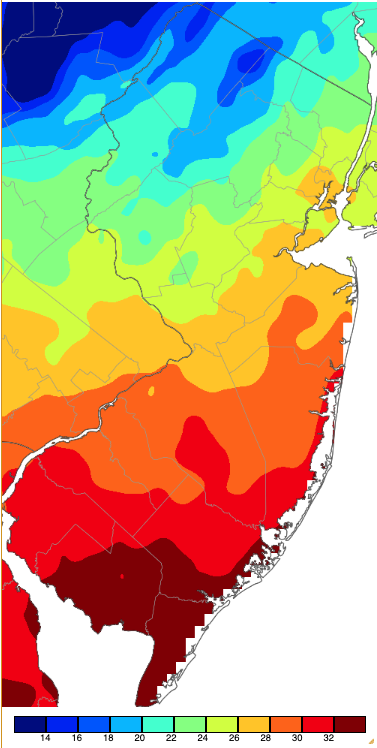
Figure 12. Annual minimum maximum temperatures across NJ during 2023 based on a PRISM (Oregon State University) analysis generated using NWS, NJWxNet, and other professional weather stations.
The coldest temperatures of the year are depicted in Figure 13. They follow a latitudinal pattern moving south until coastal Atlantic and Delaware Bay influences from nearby waters bring higher minimums to these areas. Extreme minimums fell below zero in the same general region of the coldest minimum maximums in the northwest, warming to the single digits elsewhere in northern and central areas and further south in the Pinelands. Teens were the rule further south and in the coastal areas a bit further north.
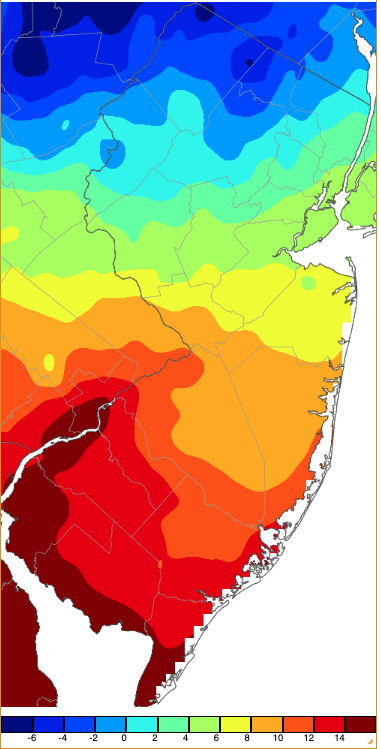
Figure 13. Annual minimum temperatures across NJ during 2023 based on a PRISM (Oregon State University) analysis generated using NWS, NJWxNet, and other professional weather stations.
The maximum minimum temperatures mapped in Figure 14 are within 2° of 70° in interior northern and central NJ. They rise to the mid to upper 70°s in the urban northeast and south of the Interstate 195 corridor, approaching 80° from about Camden down along the Delaware River and Bay coasts to southern Cape May County.
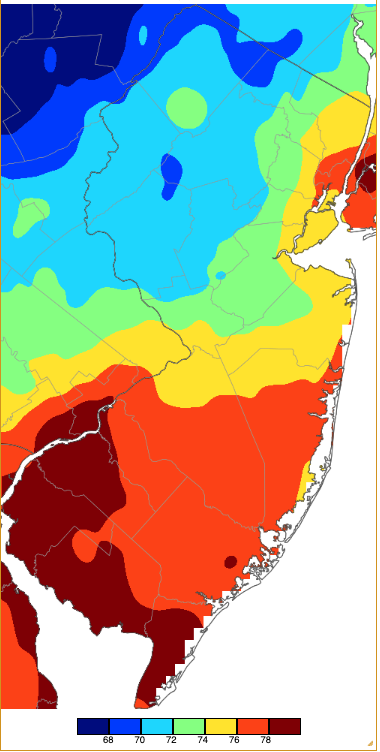
Figure 14. Annual maximum minimum temperatures across NJ during 2023 based on a PRISM (Oregon State University) analysis generated using NWS, NJWxNet, and other professional weather stations.
Annual precipitation averaged 50.24”, which is 2.68” above the 1991–2020 normal and ranks 29th wettest since 1895. Despite the year being on the wet side, five months had above-average precipitation and seven below. This demonstrates the on-again off-again nature of precipitation in 2023, when extended dry intervals were often terminated by heavy rains. Not the consistent, ample (but not too ample) rainfall pattern that most in the water management, agriculture, and other communities covet, but so things transpired. December 2023 was the wettest 12th month on record and September the 6th wettest. No month made the top 10 on the dry side of the ledger. The northern half of the state was wettest, with more frequent dry spells in the south (Figure 15). The northern climate division averaged 55.04” for the year, which is 6.32” above normal and ranks 18th wettest of the past 129 years. The southern division caught 47.14”, which is 0.26” above normal and ranks 38th wettest. The coastal division averaged 48.84”, which is 2.26” above normal and ranks 26th wettest.
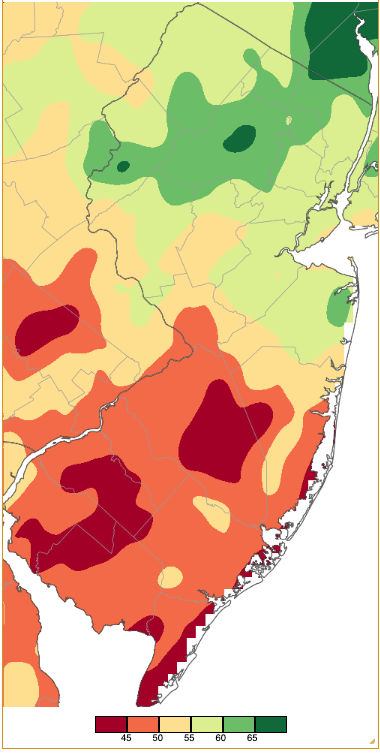
Figure 15. Annual 2023 precipitation across New Jersey based on a PRISM (Oregon State University) analysis generated using NWS Cooperative and CoCoRaHS observations. NJ totals ranged from 40.00”–44.99” (red) to 65.00”–69.99” (dark green).
Annual precipitation at individual CoCoRaHS stations reached a maximum of 72.15” in Newton (Sussex), followed by White Township (Warren) 70.60”, Mine Hill Township (Morris) 69.92”, Denville (Morris) 67.87”, Chester Township (Morris) 67.80”, and Wayne Township (Passaic) 66.79”. The driest location was Atlantic City Marina (Atlantic) with 36.83, followed by Ocean City (Cape May) 39.66”, Wildwood Crest (Cape May) 40.12”, Winslow Township (Camden) 41.46”, and Washington Township (Gloucester) 42.83”.


