For the 15th consecutive year, we in the state climate office have evaluated the myriad daily, monthly, and annual observations gathered across New Jersey during the course of the year to choose what we feel were the most significant and impactful 10 weather and climate events of 2023. More about each event can be found in the monthly narratives posted on our website. You might be tempted to rearrange the rankings, particularly as some of the events on the list may have affected you more than others ranked higher. Or perhaps you best recall one that didn't make the list. That's the enjoyment and frustration of lists! Unless stated otherwise, statewide values are based on an average of several dozen stations. The period of record for monthly, seasonal, and annual departures is 1991–2020; while for extremes and rankings it is from 1895–present. Observations are mainly drawn from National Weather Service Cooperative Observing Program stations, Rutgers NJ Weather Network stations, and NJ Community Collaborative Rain, Hail, and Snow Network locations.
- Smoke gets in your eyes
- Imported from Canada (ranging British Columbia to Nova Scotia forests) on a number of days in May, June, July, August, and October.
- Smoke was most often at high altitudes (20,000 feet), but in some cases arrived in NJ at or near the surface.
- Smoke was exceptional on June 7th, particularly in northern and central regions. Air quality was extremely unhealthy, and the skies were darkened, in some locations turning them an orange hue, with streetlights on at midday.
- Tornado bonanza
- Annual total of 13, ties with 2021 for 2nd most in year since 1950 (record remains 18 in 1989).
- Ratings included 4 at EF2 strength, 7 EF1, 2 EF0.
- February 21st EF2 was only the 5th observed in winter; the most notable of all.
- On April 1st, 7 twisters touched down, including 2 EF2s and 5 EF1s. The second time since 1950 that as many as 7 occurred in a day, the other time being November 16, 1989, with 2 F1s and 5 F0s.
- Others touched down on June 16th (EF0), June 26th (EF1), August 7th (EF0), and August 10th (EF1, EF0).
- Yet another warm year
- Annual: 55.4° or 55.5° (1.8° or 1.9° above normal pending final numbers from NOAA), 3rd warmest on record.
- Seasonal: Winter (Dec 2022–Feb 2023) 2nd warmest.
- Monthly:
- 8 months above average.
- 5 months in the top 10 for warmth. January ranked 1st, February 3rd, April 3rd, October 9th, and December between 3rd and 5th (pending final numbers from NOAA).
- January was warmer than any February of the past 128 years, 23 Novembers, 84 Marches, and all but 5 Decembers.
- Nine of the 10 warmest years have occurred since 2006, with 6 of these in the last 9 years (2016–2023).
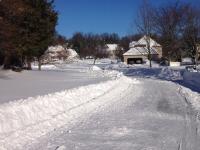
- Snow drought
- 2022/23 season snowfall ranked 3rd least for NJ (4.8”). Divisional ranks were 1st (0.4”) south, 3rd (3.9”) central, and 7th (13.8”) north.
- Record late start for the first measurable snow in some locations (e.g., February 1st in New Brunswick).
- Early 2023/24 season (October–December) essentially snow-free except at the highest elevations.
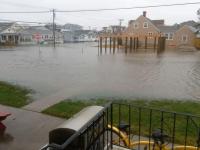
- December deluge
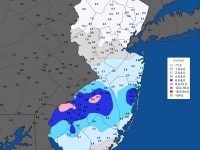
- Wettest December on record, with approximately 8.50” on average statewide, around 4.25” above normal (pending final numbers from NOAA). Surpasses the 7.87” in 1996.
- Major event on the 17th into the 18th.
- As much as 5.68” in Oakland (Bergen).
- Many locations received 3.00”–5.00”.
- One of the top winter precipitation event totals on record.
- Major flooding in Passaic and Raritan basins. 9th highest crests on record at both Little Falls (main Passaic River gage) and Bound Brook (main Raritan River gage).
- 28 NJWxNet stations gusted between 40–56 mph. Reports of other stations close to 60 mph.
- Minor to moderate coastal flooding. Massive wave action.
- Additional significant events
- 10th–11th
- As much as 3.61” at Bradley Beach (Monmouth).
- Many locations 1.00”–3.00”.
- Wind gusts over 40 mph at coastal and higher northwest locations.
- 27th–28th
- As much as 3.45” in Bernards Township (Somerset).
- Many locations received 1.00”–3.00”.
- Minor to borderline moderate flooding in Passaic and Raritan basins.
- Local wildfires
- Mostly in the Pinelands. No deaths or major injuries. Minimal property damage. Road closures. Local and downwind smoky conditions.
- Examples (county; acres): March: Stafford-Forge Wildlife Management Area in Little Egg Harbor Township (Ocean; 400); April: Manchester Township (Ocean; 3,859), Little Egg Harbor Township (1,607), and West Milford (Passaic; 972); June: Bass River State Forest (Burlington; 5,500); August: Wharton State Forest (Burlington/Camden; 1,700).
- Warren County soaking and landslide
- July 13–16 localized multi-part event deposited as much as 12.24” in White Township. This total has a recurrence interval of 200–500 years.
- Flooding damaged homes, roads, and bridges. A landslide closed a portion of Route 46 for over a week.
- A Federal Disaster Declaration was issued for the county.
- Post-tropical cyclone Ophelia kept on giving
- Part 1: Rain moved in from the south late on the September 22nd, was heavy on the 23rd, dissipating early on the 24th. As much as 5.23” in Toms River (Ocean). Gusts in the 40–60 mph range near the coast. Coastal flooding at high tide on the morning of the 23rd.
- Part 2: Rain resumed in central and northern NJ later on the 24th, lasting into early on the 25th as Ophelia’s remnant low stalled off the coast. Montague (Sussex) caught 2.46”.
- Part 3: Persistent rain and drizzle at the coast on the 25th–26th (1.37” at Pine Beach [Ocean]). Gusts continued in the 40–50 mph range at the coast as tidal flooding continued (a full moon contributed).
- Part 4: Ophelia’s still stalled remnants merged with a cold front moving in from the west late on the 28th into the 29th. Excessive rainfall along coastal Monmouth County totaled 10.40” at Bradley Beach and 9.00” at Neptune.
- These rains contributed to making September 2023 NJ’s 6th wettest.
- Widely-varying growing season from northwest valleys to the coast
- The NJWxNet valley station at Walpack (Sussex) achieved a 135-day growing season, between last spring (May 26th) and first fall (October 9th) freezes.
- NJWxNet stations at Atlantic City Marina (Atlantic), Harvey Cedars (Ocean), and Lower Alloways Creek Township (Salem) had 249-day growing seasons, each between last spring (March 20th) and first fall (November 25th) freezes.
- A 114-day difference in growing season length between these extremes (versus 85 days in 2022).
- Warm episodes abound
- January 1st–5th saw some NJWxNet stations with highs of 60° or greater, including 71° in Egg Harbor Township (Atlantic) on the 4th.
- April 1st–8th and 12th–15th saw stations reach 80° or higher, including 88° at Oswego Lake (Burlington) on the 6th and 92° in Sandyston (Sussex) on the 13th and 14th.
- July 3rd–8th saw highs exceed 90° each day, including 95° at Piney Hollow (Gloucester) on the 5th and 95° in Moorestown (Burlington) on the 6th.
- September 1st–7th found highs of 90° or greater each day, including an annual NJ maximum of 100° at Fort Dix (Burlington) on the 7th.
- October 1st–6th found stations reaching at least 80°, including 87° in Basking Ridge (Somerset) on the 9th.
- October 26th–30th (excluding the 29th) saw highs of 80° or greater, including multiple stations up to 84° on several days.
- November 4th–8th found temperatures of 68° or higher at some locations, including 76° in Egg Harbor Township on the 8th.
- April 28th–30th: 5.06” in Toms River (Ocean); April 30th–May 1st: 3.62” Eatontown (Monmouth).
- June 23rd–24th: 3.27” Hammonton (Atlantic); June 25th–27th: 7.05” Lebanon (Hunterdon).
- July 9th: 5.22” Califon (Hunterdon)
- November 21st–22nd: 2.75” North Arlington (Bergen); November 26th: 1.75” Mine Hill (Morris).
Also ran: Notable rain events not covered above. Mentioned due to their magnitude and also because most followed extended dry spells.


