Workers clean snow from MetLife Stadium on January 22, 2014, as the stadium prepares to host the Super Bowl. (Photo Credit: John O'Boyle/The Star-Ledger)
Listed below is the Office of the NJ State Climatologist's ranking of the top 10 weather and climate events of 2014. More about each event can be found in the monthly narratives posted on njclimate.org. You might be tempted to rearrange the rankings, particularly as some of the events may have affected you more than others higher on the list. That's the enjoyment (and frustration!) of lists. This was the second consecutive year that was not too eventful for NJ weather and climate (goodness, we remain stunned by 2011 and 2012). Of course there is still plenty to talk about.
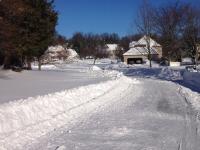
- "Endless" winter. Well at least it seemed that way to many.
- January–March temperatures averaged 30.5°, which is 4.9° below normal.
- 20 snow events occurred where 2” or more fell in one or more locations around the state. This includes four events in December 2013.
- Arguably this was the most impactful winter on day-to-day life since the winter of 1993/94.
- 3rd coldest December–February since 1982.
- Coldest minimum temperatures, in some locations, since 1994.
- At noon on January 7, High Point Monument (Sussex) was -3°, the coldest reading in the state, and West Cape May was 12°, the coldest daytime readings since January 19, 1994.
- Minimum temperatures at Walpack (Sussex County) fell below 0°on 27 days (includes occurrences in Dec–Mar). While not a record for a NJ station, it may fall second to the 30 days at Layton in the winter of 1960/1961.
- Statewide snowfall averaged 54.3” (October–April).
- This is 28.4” above average and the 7th snowiest season since records began in 1894/95. January ranked 8th and February 7th most snowy.
- Two largest statewide events on January 2–3 and January 21–22.
- Three significant March events in south Jersey, each missing the northern counties. The south ranked 7th snowiest, while statewide the rank was only 28th.
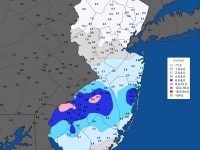
- Heavy rainfall and flooding on April 30th–May 1st.
- Washington Township (Gloucester) received 6.52”.
- Locations in 11 counties received 5.00” or more, with 6 counties between 4.00”–4.99”.
- Widespread flooding, including the 7th highest flood crests of the past century on the Millstone River at Blackwells Mills and the Raritan River at Bound Brook (yet below crests in 1999, 2007, 2010 and 2011).
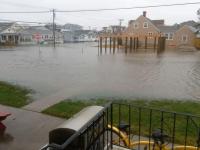
- August 12–13 deluge from Cumberland County to the central coast.
- 8.94” in Millville (Cumberland) was a 100-year (1% chance) event. Lacey Township (Ocean) reported 8.35”.
- Part of a narrow zone of storms that brought 13.27” to Islip, NY.
- Localized flash flooding.
- Dry late summer and early fall in northern and central areas.
- As a result of below-normal rainfall, streamflow, and ground water levels, this region was placed in the D0 category (abnormally dry) in the US Drought Monitor. At year's end only Warren and Sussex counties remained in this category.
- December 10th nor’easter.
- Coastal flooding was at the high end of "minor" to the low end of "moderate." In most locations it was the worst since Sandy, but nowhere near that event.
- Wind gust up to 55 mph at Harvey Cedars (Ocean) and 49 mph in Sea Girt (Monmouth).
- 3.17” of rain in Belmar (Monmouth).
- A comfortable summer.
- June–August average temperature of 72.0° was 0.8° below the 1981–2010 mean. This ranks as the 55th warmest of the past 120 summers, and exactly matched the 1895-present mean.
- This followed four consecutive summers with temperatures averaging in the top 15 (since 1895), an unprecedented run of abnormal warmth.
- Most weekends had superb weather.
- White Thanksgiving for the northern half of the state.
- Thanksgiving eve brought up to 12.5” of snow at Montague (Sussex).
- A white Thanksgiving morning (inch or more on the ground) north of the Route 1 corridor. First widespread one for the north since 1989.
- It wanted to rain along the coast, but not so much the case at the extreme ends of the state.
- Annual precipitation totaled 66.76” in Lacey (Ocean), 63.25” in Belmar (Monmouth), 59.55” at Brick (Ocean), and 59.48” at two locations in Howell (Monmouth) and in Berkeley Township (Ocean).
- In the southwest, Gloucester County was wet, with Franklin Township receiving 61.66” and 57.10” in Clayton.
- On the other side of the ledger, in the northwest, Sussex County was dry with only 40.70” falling at Wantage. So too was Cape May County, with 42.56” in Middle Township and 43.18” at Wildwood Crest.
Honorable mention (in no particular order):
- Wildfires erupted across the state in April before the end-of-month dousing put an end to them. Prior to the storm, an extended period of dry weather included multiple days with gusty winds and low humidity. Fires included ones of 1500 and 300 acres in Burlington and Ocean counties, respectively.
- A 106-day difference in growing season length (days between the last spring freeze and first fall freeze) across NJ, with 126 days at Walpack (Sussex: May 20–September 22)
to 232 days at West Cape May (Cape May: March 28–November 14). The range in 2013 was 103 days.
- Average monthly temperature were below average for seven months, four of them more than 3° below. Only one of the five above-average months was more than 3° above average. Precipitation was above average during six months and below average for six. Only two months were over an inch above average and one more than an inch below.


