November Overview
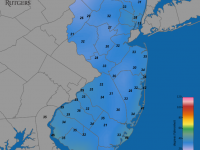
The dry first three weeks of November kept everyone waiting and wondering if a record dry month might be at hand along with increasing drought concerns. To the rescue came two rain events on the 21st–22nd and 26th to bring the monthly average precipitation to a rather respectable total. The statewide average of 2.68” was 0.68” below normal, ranking 52nd driest of the past 129 Novembers. Unlike recent months, it was the coastal northern counties that were driest, while the central north was wettest (Figure 1). The northern division (Hunterdon-Somerset-Union counties northward) averaged 2.92” (-0.55”, 50th driest), the southern division (Mercer-Middlesex-Monmouth counties southward, except along the coast) 2.56” (-0.73”, 53rd driest), and the coastal division (roughly the Garden State Parkway to the coast) 2.24” (-1.10”, 42nd driest).
Snowflakes were seen in a few northern locations on the 1st, a dusting occurred at higher elevations at the start of the 21st–22nd rain event, and flurries and a few measurable dustings from squalls occurred on the 28th. Despite the scattered dustings, regionally and statewide records show an absence of accumulation. This is 0.5” below normal but has been seen in 52 of the previous 128 Novembers.

Figure 1. November 2023 precipitation across New Jersey based on a PRISM (Oregon State University) analysis generated using NWS Cooperative, CoCoRaHS, NJWxNet, and other professional weather station observations from approximately 8 AM on October 31st to 7 AM on November 30th. Note the scale in inches at the bottom of the map. Totals range from 1.00”–1.50” (dark red) to 4.00”–4.50” (dark green).
At 43.2°, the statewide November 2023 average temperature fell 1.9° below the 1991–2020 normal. This ranked as the 62nd coolest/67th warmest November in records dating back to 1895 (tied with one other year). The northern climate division averaged 41.0° (-2.1°, 60th coolest/68th warmest; tied with two other years), the southern division 44.5° (-1.8°, 63rd coolest/615th warmest; tied with two other years), and the coastal division 45.7° (-1.6°, 68th coolest/62nd warmest).
Precipitation and Storms
Individual locations around NJ received monthly precipitation totals of anywhere from 4.45” in Montclair (Essex County) to 1.34” in both Long Branch (Monmouth) and Point Pleasant Beach (Ocean). Other larger totals include Randolph Township (Morris) 4.43”, Denville (Morris) 4.42”, and both Morristown (Morris) and Little Falls (Passaic) with 4.34”. A second Denville station caught 4.18” and another in Little Falls 4.27”. Among the drier locations were Brick (Ocean) with 1.36” at one station and 1.63” at another, Neptune (Monmouth) 1.45”, Millstone Township (Monmouth) 1.62”, and Pine Beach (Ocean) 1.71”.
Despite being quite dry for the first three weeks of the month, showers from late on October 31st to early on the 1st brought 0.63” to Wildwood Crest (Cape May), North Wildwood (Cape May) 0.62”, and 0.40”–0.55” at five Lower Township (Cape May) CoCoRaHS stations. Little to no rain fell elsewhere in the state. Light rain visited the north early on the 7th, with 0.32” in Sparta (Sussex) and 0.25” in Ringwood (Passaic) being the most reported. Early southern rain on the 10th brought 0.35” and 0.31” to two Hammonton (Atlantic) stations and 0.33” to Winslow Township (Camden). Yet another minor pre-dawn event saw Denville catch 0.16” and three Lebanon (Hunterdon) stations each with 0.10” on the 18th. This system produced a wind gust of 40 mph at High Point Monument (Sussex) on the 18th, the first of six days in the month with a 40 mph or higher gust observed at a Rutgers NJ Weather Network (NJWxNet) station. A 40-mph gust was recorded at Vernon Township (Sussex) on the 19th.
A substantial storm finally arrived on the afternoon of the 21st. It first brought rain to the south and a dusting of snow, the first of the season, to higher elevations in the northwest. The evening and early hours of the 22nd saw heavy rain fall throughout the state (Figure 2). Portions of the north and far south caught the most, topped by 2.75” in North Arlington (Bergen), followed by Maplewood (Essex) 2.68”, Lower Township 2.62”, Harrison (Hudson) 2.62”, Montclair 2.61”, Palisades Park (Bergen) 2.60”, Lyndhurst (Bergen), Randolph Township, and Springfield (Union) each with 2.55”, Denville 2.51”, and Verona (Essex) 2.50”. Sixty one of the 279 CoCoRaHS stations reporting caught 2.00”–2.49”, 152 from 1.50”–1.99”, 45 from 1.00”–1.49”, and six from 0.89”–0.99”.
On the 21st, winds gusted to 49 mph at both Vernon Township and Sea Girt (Monmouth), 44 mph in Harvey Cedars (Ocean), 42 mph at Seaside Heights (Ocean), and 41 mph at Lower Alloways Creek Township (Salem). Gusts on the 22nd reached 47 mph in Sea Girt, Harvey Cedars 42 mph, and Seaside Heights 40 mph. Behind the storm, gusts reached 42 mph at High Point Monument on Thanksgiving, the 23rd.

Figure 2. Precipitation across New Jersey from 7 AM on November 21st through 7 AM November 22nd based on a PRISM (Oregon State University) analysis generated using NWS Cooperative, CoCoRaHS, NJWxNet, and other professional weather station observations.
Bookending the Thanksgiving holiday weekend, the second storm of the late month arrived during the afternoon of the 26th and was quickly out of the state by about midnight. It produced rainfall totals of as much as 1.75” at Mine Hill (Morris), Randolph Township, and Little Falls, with Verona 1.70”, Glen Rock (Bergen) 1.68”, another Randolph Township station 1.66”, and both Montclair and Morris Township (Morris) 1.65” (Figure 3). 115 of 255 reporting stations received from 1.00”–1.64” and 64 sites from 0.50”–0.99”. Pine Beach saw the least at 0.15”.

Figure 3. Precipitation across New Jersey from 7 AM on November 26th through 7 AM November 27th based on a PRISM (Oregon State University) analysis generated using NWS Cooperative, CoCoRaHS, NJWxNet, and other professional weather station observations. Note that the color scale used in this figure is the same as in Figure 2.
The 28th was a blustery day with flurries reported at various locations across NJ. Some squalls brought the first measurable snowfall of the season, including 0.2” at Hamilton (Mercer) and Sparta. Winds gusted as high as 42 mph at Fortescue (Cumberland) and Lower Alloways Creek Township and 41 mph in Little Egg Harbor Township (Ocean).
The barometer was rather high the first three weeks of the month, reaching 30.45”–30.55” on the 2nd, 3rd, 12th, 20th, and 21st. Lowest pressures of 29.55”–29.70” occurred on the 26th.
Temperature
There were 14 November days when one or more NJWxNet station had a high temperature at or above 60°. Seven of those days saw highs of at least 65°. The first of these was the 4th when Egg Harbor Township (Atlantic) and Little Egg Harbor Township reached 68°, with 48 of the 67 NJWxNet stations topping out from 60°–67°. The 5th was the warmest day of the month statewide, with 73° at Lower Alloways Creek Township, 70°–71° at 13 sites, and 60°–69° at 49 locations (Figure 4).

Figure 4. Maximum temperatures on November 5th based on a PRISM (Oregon State University) analysis generated using NWS, NJWxNet, and other professional weather stations. Note the 2° scale beneath the map.
Piney Hollow (Gloucester) rose to 65° on the 6th, with 35 stations from 60°–64°. Cape May Court House (Cape May) and Egg Harbor Township each reached 73° on the 7th, with four stations from 70°–72° and 61 from 60°–69°. The 8th was the warmest day of the month in south Jersey but not up north (Figure 5). Egg Harbor Township shot up to 76° followed by 26 stations from 70°–74° and 29 at 60°–69°.

Figure 5. Maximum temperatures on November 9th based on a PRISM (Oregon State University) analysis generated using NWS, NJWxNet, and other professional weather stations. Note the 2° scale beneath the map.
Hammonton, Hillsborough-Duke (Somerset), and Piney Hollow all reached 69° on the 16th, with 62 stations from 60°–68°. Fort Dix (Ocean) and Hammonton made it to 72° on the 17th, with 20 sites either 70° or 71° and 45 from 60°–69°.
On the cooler side of daily high temperatures this month was High Point Monument, the highest elevation station in NJ, achieving the state’s lowest maximum temperature on 27 days.
Low temperatures fell to freezing at one or more NJWxNet station on every November day except the 7th and 22nd. On 19 days, Walpack (Sussex) was the coldest, evidence that there were many nights with clear skies and calm winds that permitted this and other valley locations to collect the coldest near-surface air. There were 11 days when at least one NJWxNet station fell below 20°. This began with 20° lows at Walpack on the 2nd and 3rd. The 12th found Walpack at 19° and 16° on the 13th, when four locations hit 18°–19° and 32 from 20°–25°. Walpack was 19° on the 15th and 17° on the 20th when 14 stations dropped to 20°–25°. Walpack was again 17° on the 21st, with Pequest (Warren) at 19°.
The teens were reached again on the 25th, with Walpack at 16°, Hopewell Township (Mercer) 17°, and both Hillsborough-Duke and Kingwood (Hunterdon) 19°. Thirty-five stations dropped to 20°–25°, but most notable about this morning was all NJWxNet stations dropping to 32° or lower for the first time since March 20th. The last holdouts included Seaside Heights, Harvey Cedars, Atlantic City Marina (Atlantic), and Lower Alloways Creek Township. These freezes marked the end to New Jersey’s growing season, defined as the number of days between the last spring and first fall freezes. NJ’s longest 2023 growing season of 249 days occurred at three of these locations, namely Atlantic City Marina, Harvey Cedars, and Lower Alloways Creek Township. On the opposite end of the spectrum, Walpack received its last spring freeze on May 26th and first fall freeze on October 9th for the state-shortest 2023 growing season of 135 days, an impressive 114-day difference across the state.
Cold prevailed on the 26th, with Walpack at 17° and Pequest 19°, and 27 stations from 20°–25°. The 28th saw arctic air advecting into NJ on strong winds. This led to the first day of the season with a station remaining below freezing for the entire 24 hours. The three highest elevation stations in the NJWxNet, High Point Monument, High Point (Sussex), and Vernon Township all met that mark. Next up on the 29th was the coldest November 2023 day, with Walpack down to 15°, six stations from 17°–19°, 51 from 20°–25°, and West Cape May (Cape May) “mildest” at 28° (Figure 6). The 30th found Pequest down to 17° and five sites 18° or 19°.

Figure 6. Minimum temperatures on November 29th based on a PRISM (Oregon State University) analysis generated using NWS, NJWxNet, and other professional weather stations. Note the 2° scale beneath the map.
Fall 2023 Overview
Fall precipitation averaged 12.54”, which is 0.83” above the 1991–2020 average. This ranked as the 34th wettest fall since 1895. The northeast and northern coast were wettest, in large part due to heavy late-September rains associated with the remnants of Tropical Storm Ophelia (Figure 7). The southwest most often missed out on rain events, thus came in driest. The wettest CoCoRaHS stations included Neptune (Monmouth) with 20.63” at one site and 20.25” at another, Long Branch (Monmouth) 20.40”, Eatontown (Monmouth) 19.63”, Ocean Township (Monmouth) 19.47”, Palisades Park (Bergen) 19.08”, and Wall Township (Monmouth) 18.68”. On the dry side, Franklin Township (Gloucester) received just 8.46”, Winslow Township (Camden) 8.64”, Evesham (Burlington) 9.22”, Hammonton (Atlantic) 9.29”, Upper Deerfield (Cumberland) 9.34”, and Medford Township (Burlington) 9.92”.

Figure 7. Fall precipitation across New Jersey from 8AM on August 31st through 7AM November 30th based on a PRISM (Oregon State University) analysis generated using generated using NWS Cooperative and CoCoRaHS observations. Note the scale in inches beneath the map.
The statewide average temperature for fall was 56.4°. This was 0.6° above the 1991–2020 normals and ranks as the 19th warmest fall since 1895. The highest temperatures reached across the state during the season are mapped in Figure 8. The coldest all occurred on November 29th, the distribution of these temperatures found above in Figure 6. Through the first 11 months of 2023, the average temperature has been 56.7°. This is 1.7° above normal and ranks as the 4th warmest January–November on record in New Jersey.

Figure 8. Extreme maximum temperatures during fall 2023 (September 1st–November 30th) based on a PRISM (Oregon State University) analysis generated using NWS, NJWxNet, and other professional weather stations. The seasonal maximum occurred on different days at different locations. Note the 2° scale beneath the map.


