


 to provide insulative ice cover, protecting the buds from temperatures that fell into the upper 20°s. Photo courtesy of D. Specca.")
 on March 6th. Photo by Dave Robinson.")
 during the afternoon of February 23rd towards the end of major winter storm. Around 23\" of snow was reported in Jersey City. Photo by The Star-Ledger.")
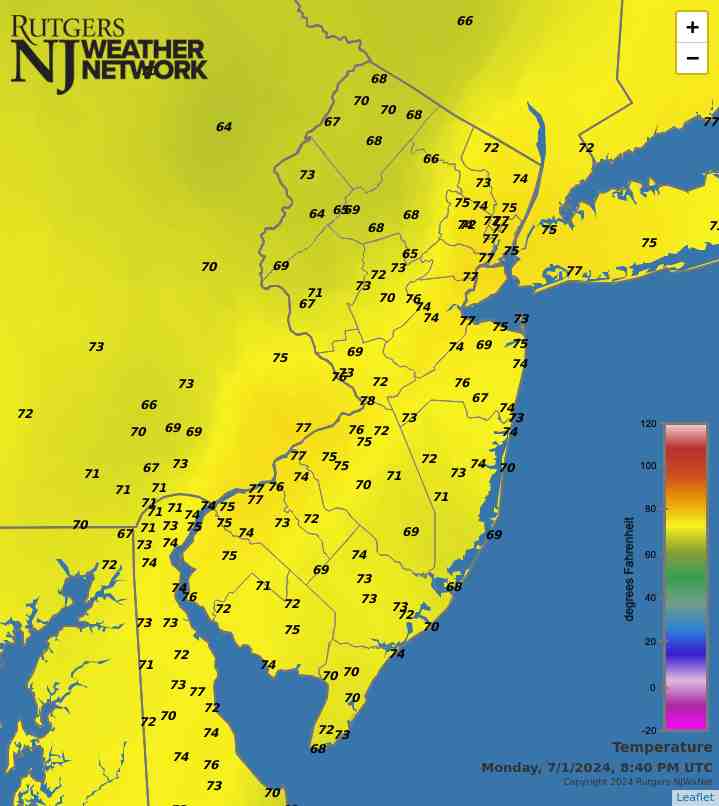
Danger Lurks: July 2025 Recap
. Photo by Seth Wenig/AP Photo.")
Tragically, this July demonstrated how weather danger lurks across the Garden State during summer months. July thunderstorm winds felled trees that resulted in three fatalities, lightning strikes killed two and injured others, and flash flooding took two lives and put countless others in perilous situations. No doubt, the often-relentless heat and humidity led to medical issues for those most vulnerable, be they old, young, infirmed, employed outdoors, or living in stifling locations devoid of air conditioning.
Temperature-wise, the July statewide average temperature of 78.1° was 2.7° above the 1991–2020 mean and ranked as the 6th warmest since records commenced in 1895. The average high of 87.7° was 2.0° above normal, ranking 12th warmest, while the average low of 68.5° was 3.4° above normal, ranking 3rd warmest. Eight of the ten warmest Julys have occurred since 2010 and twelve of fifteen since 1999. Only three Julys in the past 25 years have averaged below the 1991–2010 normal. The June–July average of 75.0° is the 5th warmest, only exceeded by 76.1° in 2010, 75.6° in 2024, and 75.2° in both 2020 and 2011.
The 5.44” statewide average July precipitation was 0.73” above normal, ranking 42nd wettest of the past 131 Julys. As is often seen during summer months, totals varied markedly over rather short distances, seen this month in both the north and south. Overall, the north averaged 4.62” (-0.10”, 64th wettest/68th driest), south 5.93” (+1.19”, 26th wettest), and coast 6.08” (+1.70”, 20th wettest).
 on June 25th. Photo by Dave Robinson.")
 was held on the sunny and dry afternoon of May 26th. The competition is the oldest bicycle race in North America, with top national, international, Olympic, and professional cyclists participating.")
.")
 on March 20th. Photo by Judy Kopitar.")
. Photo by Jan Humphreys")
 on January 24th. According to boaters, this was the first time conditions allowed for ice boating since 2018.")
 on December 9th, 2024. December helped ameliorate drought conditions, but not eliminate it. Photo by Julian Leshay Guadalupe/NorthJersey.com")
 on October 24th, 2024, revealing a \"ghost bridge\" that had been used by stagecoaches on the original roadbed of the Paterson-Hamburg Turnpike. Photo by Andre Malok/NJ.com.")
 on the morning of November 22nd with a fresh 20.0” snowfall (photo courtesy of Shawn Viggiano).")