Introduction
Observations of soil temperature and water content are among the many variables gathered at stations within the Rutgers NJ Weather Network (NJWxNet). While observations at 5 and 10 centimeter (cm) depths for water content have been taken at about a dozen NJWxNet stations as far back as 2003, only since 2013 have soil temperature and water content observations been taken at 5 cm, 10 cm, 20 cm, and 50 cm at currently nine stations across New Jersey (Figure 1). The soil and atmospheric observations at these sites provide an understanding of soil–atmosphere interactions, such as how soil conditions respond to atmospheric forcings. Soil temperature and water content also influence atmospheric conditions; however, this is exceedingly difficult if not impossible to demonstrate at individual locations. Prior to the advent of the NJWxNet, soil temperature and water content observations were almost completely lacking across NJ. This was the rule across the United States and beyond until recently when mesonets, such as the NJWxNet, began providing vital data that will continue to lead to improved short- and long-term weather and climate forecasts.
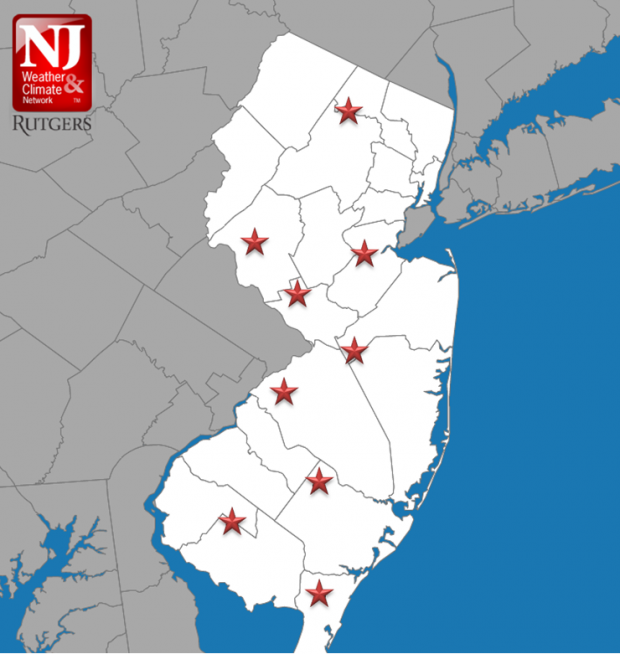
Figure 1. Location of stations that collect soil data
The objective of this report is to introduce the soil data being gathered at NJWxNet stations and to demonstrate the potential value of these observations to agricultural, hydrological, meteorological, engineering, and other communities. For instance, for the agricultural community, the difference between a bountiful harvest and a sub-par one is quite dependent on soil conditions, not solely on what is occurring in the atmosphere. Understanding present soil conditions and analyzing past trends of soil water content and temperature can help a farmer determine when to plant, what crops to plant and, once growth commences, when to irrigate.
Observations and Methods
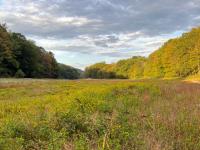
Of the nine premiere soil stations in the NJWxNet, Pittstown (Figure 2) is the longest active one, so these data were used for this analysis. This station is situated at the Rutgers NJ Agricultural Experiment Station’s Snyder Farm, not too far from Alexandria Airport in Hunterdon County (Figure 1). Soil at the observing site is classified as loam that is generally well drained. Soil conditions at 5 and 10 cm have been observed there since the station was commissioned in 2003. Soil instrumentation was upgraded and installed at 5, 10, 20, and 50 cm in 2012, with five-minute reports gathered since 2013. Multiple Python programs were written to transform 5 minute values to hourly and daily ones, as the longer averaging intervals suffice for soil monitoring, where changes are relatively slow to occur in comparison with atmospheric variables. A variety of graphical plots were generated to explore potential relationships between the soil and atmospheric variables.
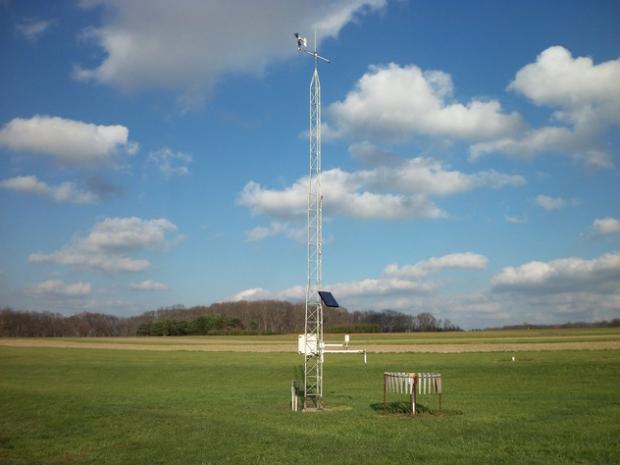
Figure 2. View of Pittstown NJWxNet station in Hunterdon County
Results
The eight graphs below illustrate the range of soil conditions occurring on a variety of time scales. Comparisons are also made between soil and variables including air temperature, precipitation, and snow depth. Each graph is accompanied with bulleted comments that describe what is being shown and, in some cases, speculate as to why these conditions are observed.
Five-day soil temperature running averages at four depths from 2015-2018:
• The annual temperature cycle dominates.
• Temperatures during winter months vary between 30°F–40°F, most always colder at shallower depths.
• Winter 2015 conditions were coldest and 2017 mildest.
• Soil temperatures in the summer vary from 70°F–80°F, most always warmer at shallower depths.
• Summer 2016 conditions were warmest, with little difference among the other 3 years.

Five-day soil temperature running averages at four depths in 2014:
• Temperatures at depths of 5, 10, and 20 cm are quite similar, whereas at 50 cm depth temperatures are milder than at shallower depths in winter and cooler in summer.
• The 5 cm depth has the highest inter-annual range of temperatures, with a maximum of 76°F and a minimum of 32°F in 2014.
• The 50 cm soil depth temperature intersects the shallow-depth soil temperatures in the spring and fall.

Five-minute soil temperature observations in April 2018:
• Diurnal variations in air temperature are also seen in soil temperatures at shallow depths, but not at 50 cm.
• 5 cm soil temperature fluctuations are similar to those of the air temperature, but smaller in scale.
• Diurnal variations at 10 cm and 20 cm depths are delayed by up to several hours and are more subdued than in the atmosphere and at 5 cm depth.

Five-minute soil temperature and snow depth observations in March 2018:
• Soil temperatures do not vary diurnally when snow cover is present. Again, this appears to be due to the insulative effect of the snow cover and perhaps also meltwater infiltrating the soil.
• The gradual decrease in soil temperature during this time is likely the result of colder March air temperatures than during the previous February.
• After snow melts, it takes time for the soil temps to return to a more typical response time and magnitude, especially for the shallower soil depths. You can see a small peak midday on the 17th, progressively increasing in amplitude despite similar air temperature variations, up until the 20th, when the temperature profile reverts to a more normal winter configuration, with the shallowest depths being coldest.

Five-day soil water content running average and five-day total liquid precipitation in 2018:
• The "Water Content" variable referenced in the plot above refers to the Volumetric Water Content (VWC). VWC is a ratio of the volume of water to the volume of soil. For example, VWC of 0.30 translates to 3 parts water to 10 parts soil.
• As expected, there is a strong association between precipitation (or the lack thereof) and soil water content. This relationship is more subdued at 50 cm depth than at shallower depths.
• There is an observed delay in response time for increased water content following precipitation that increases with depth. This lag represents the time involved for rain water to percolate to deeper depths.
• As observed in the plot, the soil water content at Pittstown station rarely exceeds 0.40, and never exceeds 0.45 despite an additional influx of water entering the soil in the form of precipitation. This suggests that the threshold for water content is near 0.45, or up to 45% of the soil can be comprised of water. A water content value of 0.45 implies a saturated soil, incapable of holding additional water, a potential precursor to flooding.
• Based off of the data presented for 2018, soil water content tends to be more variable during the warmer months of the year. This is due to the increase in solar irradiance during the summer months, which results in warmer air/ground temperatures and increased evaporation, causing more rapid drying of soils. In the winter months, there is less solar irradiance available to warm the soil and atmosphere, leading to reduced evaporation and drying of soils and smaller fluctuations in the volumetric water content. As a result, soils are more consistently wet during the colder months.
• When soil is frozen, the water content reading is inaccurate, as shown in the first week of 2018, where 5 cm water content has a reading of 0.11.

Five-minute soil temperature observations and daily precipitation totals in July 2018:
• Soil temperature variations are subdued during precip events, likely the result of cloudiness (reduced solar radiation) and water percolating through the soil profile.
• Soil temperature variations are subdued after heavy precip events due to the increased water content of soil raising the overall specific heat of the medium (heating/cooling wet soil requires more energy).
• The influence of individual precipitation events on water content is more subdued at greater depths.

Five-minute soil water content observations and daily precipitation totals in June–July 2018:
• The small precipitation event on 7/6/2018 increases water contents at 5cm and 10cm depths with little delay. This is likely due to the very dry nature of the soil prior increasing the capillary forces at play.
• There is a reduced and delayed response in water content at increasing depths.
• Water content reaches a maximum close to 0.43, during the latter half of July. This signifies a saturation level that would likely lead to surface runoff or puddling of additional precipitation.


