News

Leaning Warm, Leaning Dry: July 2015 Recap

August 1, 2015 - 8:23pm -- Dave Robinson

Flooding photo

In most respects, July 2015 was a rather common one in the weather department. The statewide average temperature of 75.5° was 0.5° deg above the 1981–2010 mean. This past June had the same positive anomaly. This ranks as the 28th warmest July since 1895. It may seem strange to have such a small departure from normal yet rank in the top quartile for warmth. This can be explained by the fact that New Jersey has gotten warmer since the end of the 19th century. Compared to all Julys since 1895, this past July was 1.3° above average. Again, this might not seem like a large difference, however, given that temperatures do not vary from year to year nearly as much in summer as in winter, this change over the past century is notable.

With an El Niño underway, how much of an impact can we expect it to have on NJ's summer weather?

July 23, 2015 - 2:29pm -- Dave Robinson

Sea Surface Temperature (SST) anomalies for July 20, 2015.  NOAA/NESDIS.

Scientists are carefully monitoring sea-surface temperatures in the tropical Pacific Ocean for a potential El Niño event. An El Niño occurs when warmer-than-average waters start to form in the eastern Pacific Ocean, specifically near the equatorial latitudes. Easterly winds (blowing from the east) typically move warmer water to the western Pacific (near Indonesia), permitting cooler water to upwell to the surface in the east (near South America). When these winds are weaker, or if they reverse direction, the warm water stays in the eastern Pacific. This difference in sea surface temperatures and winds creates a new dynamic between the ocean and atmosphere, distinctly affecting weather patterns across the world. No two El Niño events are alike; they vary in magnitude and location of the largest temperature anomalies. El Niño events can be classified as Strong, Moderate or Weak.

Drought? What Drought?: June 2015 Recap

July 4, 2015 - 7:34pm -- Dave Robinson

Roll Cloud photo

Toward the end of May, the threat of a significant drought loomed over the Garden State, as May proved to be the 3rd driest on record. Crops were in bad shape or not growing at all, and reservoir levels were declining at a faster than seasonal rate. However, New Jersey had yet to reach the point where average and timely rainfall could not remedy the situation. Not only was this prescription filled, it was done in abundance. June rainfall averaged 8.21" across NJ. This was 4.19" above the 1981-2010 normal and ranked 4th wettest since 1895 (Table 1). It joined four other Junes in the past 13 years to rank in the top eight over this 121-year period. As explained in last month's report, the rains that fell during the daytime and evening hours of May 31st factored into the June total, much as the localized afternoon and evening rains on June 30th (discussed below) will count toward the July total.

Third Warmest and Driest as Drought Concerns Arise, and a Pronounced Transition: May and Spring 2015 Recap

June 4, 2015 - 8:52pm -- Dave Robinson

Sea fog photo

May 2015 was a warm and dry month across New Jersey. As the month ended, drought concerns were looming large, though rainfall in the north during the afternoon and evening of the 31st and continuing into the first days of June resulted in at least a temporary braking of the downward slide. Based on data gathered at long-term National Weather Service Cooperative Observing (COOP) stations, May rainfall averaged 1.08" across NJ. This is 2.92" below the 1981-2010 mean and ranks as the 3rd driest May since records commenced in 1895.

As those who have been reading these monthly narratives for some time now know, precipitation that falls at COOP stations after observation time on the last day of the month gets recorded as falling on the first day of the next month. Most COOP stations observe in the morning, thus the heavy showers that fell across north Jersey on the 31st were not factored into this May average, except for a few stations such as Newark Airport (which registered 3.83" on the 31st alone) that observe at midnight. The last time this situation had a notable impact on monthly rainfall was a daytime heavy rain event on April 30, 2014.

Drought Invading New Jersey

May 28, 2015 - 11:14am -- Dave Robinson

30-Day Percent of Normal Precipitation

Whether it is a browning lawn, dry garden soil, or pollen that hasn’t washed off your car in weeks, many of us in New Jersey have recognized that the state is in the midst of an extended period of very meager rainfall. Along with the aforementioned impacts, the flow of water in streams and ground water levels as monitored in wells are below, and in some cases, well below seasonal levels. While it is fortunate that surface reservoirs in northern and central NJ are close to seasonal levels (quite full), there is less water than normal flowing into them and early season lawn watering is drawing water out of them at an unseasonable pace.

Advice provided by our office, by those within the National Weather Service and the NJ Department of Environmental Protection, and by others associated with the weekly US Drought Monitor has led to this week’s Monitor map depicting the northern third of NJ in D1 (defined as moderate drought) and the remainder of the state down to around the Atlantic City Expressway in D0 (abnormally dry). D1 can be expected to occur once every 5-10 years during a particular month, while D0 can be found every 3-5 years. While the type of conditions being experienced in parts of NJ right now are drought like, I am hesitant to call the north in “moderate” drought, and would prefer saying “minor” drought. However, this is the definition of the nomenclature decided upon by a national committee, thus within the Monitor map it is “moderate” in the north.

Spring Arrives and Remains: April 2015 Recap

May 4, 2015 - 8:36pm -- Dave Robinson

Contrails photo

Complaints are often brought to the Office of the State Climatologist that in recent years the weather in New Jersey has quickly transitioned from winter to summer, thus leaving little time for spring weather. Of course perceptions can be deceiving, as transitional months such as April typically have widely varying weather. At least for April 2015 no protests of a missing spring are warranted, as temperatures reached into the 60°s and 70°s for several days in each week of the month, yet minimums were at times in the 20°s and 30°s throughout April. There was only one major rainfall event, but there were occasional showers. A summer-like squall roared through the state late afternoon on the 22nd, followed the next day by daytime snow flurries. Now that is spring weather!

For Second Consecutive Year, Winter is Slow to Relinquish Its Grip: March 2015 Recap

April 6, 2015 - 5:25pm -- Dave Robinson

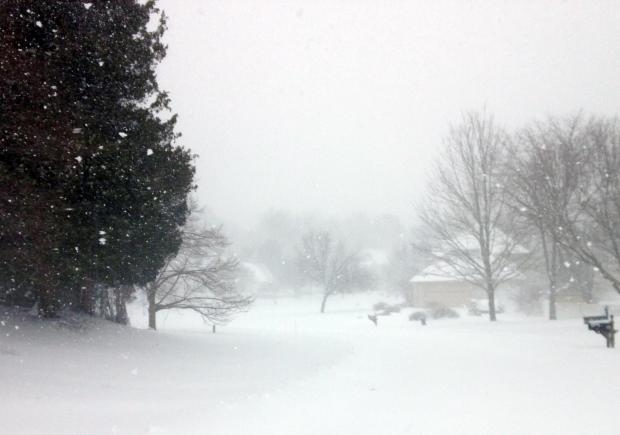
Snow on March 5

For the second consecutive year, March served as a meteorological exclamation point on an active cold and snowy season. As in 2013/14, this season had below-average November temperatures, milder-than-average December readings, and below-average January, February, and March tallies. The March temperature this year averaged 35.8°, which is 5.3° below normal and ranks as the 14th coldest since 1895.

This was also the snowiest March statewide and in central NJ since 1993. The northern counties averaged 13.6" (which is 7.5" above normal), the central region was at 14.9" (+10.0"), and the southern counties 8.6" (+5.6"). The state as a whole averaged 11.5" (+7.2"), which is the 13th snowiest March on record. For the season through March snowfall statewide has averaged 34.5" (+8.4"), with the north 50.5" (+15.8"), central 41.4" (+14.4"), and south 22.3" (+2.3"). This is the northern division's first back-to-back 50"+ seasons since the winters of 1903/04 and 1904/05.

March rain and melted snow accumulated to a statewide average of 4.95". This is 0.72" above normal and ranks as the 32nd wettest.

Warm Evenings in New Jersey

March 30, 2015 - 7:55pm -- Jack McCarty

Heat wave photo

Daily temperatures naturally fluctuate from week-to week and year-to-year (factoring out the seasonal “march” of temperature). Thus when temperature trends emerge over decades, it sparks a special interest here in the Office of the New Jersey State Climatologist. We are in the midst of a project to examine prolonged heat episodes throughout the state and have found some evidence for recent increases in such events. As impressive winter cold slowly comes to an end in NJ is there a better time to present some of our heat results? Of course not!

Our study involves examining daily maximum and minimum temperatures for seven stations distributed across the state, each with 100-plus years of records. This study began last summer with an evaluation of New Brunswick heat events. We showed that New Brunswick has had an increase of daytime heat events in recent decades and nighttime heat events are becoming more commonplace. In the course of expanding our analysis to seven stations, we have found larger changes in warm nighttime temperatures than in hot daytime temperatures. Excessively warm nighttime temperatures typically get overlooked when discussing potentially dangerous heat episodes, yet they can bring about dangerous health concerns for those unable to escape persistent warmth.

Bitter Cold: February 2015 Recap and Winter 2014-2015 Review

March 7, 2015 - 4:09pm -- Dave Robinson

High Point Monument photo

It will come as no surprise to those reading this report that February 2015 was one of the coldest months on record in the Garden State. The average temperature of 22.0° (11.8° below average) made this month the 3rd coldest February and 6th coldest (tied) of any month since statewide records commenced in 1895. Colder Januaries include 1918 (19.9°), 1977 (20.2°), and 1912 (21.9°), with 1940 equal to this past February.

Statewide, melted snow, ice, freezing rain, and plain rain amounted to 2.34". This was 0.52" below average and ranks as the 32nd driest February. There were five events where snow fell to a depth of 2" or more at one or more locations, however there was no statewide "blockbuster" storm. NJ February snowfall averaged 12.3", which is 4.2" above normal. The northern third of the state averaged 16.3" (+6.2"), central area 12.6" (+3.6"), and southern third 10.1" (+3.5"). The ground remained snow covered throughout the month in northern and central regions, consistently at a depth exceeding 10" in the north and closer to 5" in central areas.

Just How Cold Has It Been?

February 25, 2015 - 4:21pm -- Dave Robinson

Icy Cape May

The answer: remarkably cold! As if anyone living in New Jersey has any doubt. February 2015 is destined to be one of the coldest months since statewide records commenced in 1895. As observations currently stand, along with projections through month’s end, this will likely be the second coldest February and the fourth coldest of any January or February. Table 1 lists the ten coldest Februaries, based on observations gathered from several dozen stations throughout NJ. Looking north and south, it appears as if this will be the second coldest February in the north (Hunterdon, Somerset, and Union counties northward) and third coldest in the south. This is in line with the coldest core being situated over New England and the added chilling effect of the ground being snow covered throughout the month in the north, while only being so over the last two weeks down south. The two colder Januaries were in 1918 (19.9°) and 1977 (20.2°).

Pages

Subscribe to RSS - News