Scientists are carefully monitoring sea-surface temperatures in the tropical Pacific Ocean for a potential El Niño event. An El Niño occurs when warmer-than-average waters start to form in the eastern Pacific Ocean, specifically near the equatorial latitudes. Easterly winds (blowing from the east) typically move warmer water to the western Pacific (near Indonesia), permitting cooler water to upwell to the surface in the east (near South America). When these winds are weaker, or if they reverse direction, the warm water stays in the eastern Pacific. This difference in sea surface temperatures and winds creates a new dynamic between the ocean and atmosphere, distinctly affecting weather patterns across the world. No two El Niño events are alike; they vary in magnitude and location of the largest temperature anomalies. El Niño events can be classified as Strong, Moderate or Weak.
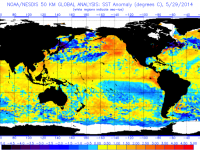
Scientists monitor the oceans through a network of buoys and formulate a forecast for El Niño events. Figure 1 shows current sea surface temperature anomalies globally, indicating a moderate El Niño event underway in the equatorial Pacific. An El Niño was declared by the NWS Climate Prediction Center in early March after months of waiting to see if official El Niño criteria would be met. NOAA has a blog to discuss this ongoing event. Confidence is high that this moderate El Niño will continue through the remainder of 2015, and perhaps strengthen further.
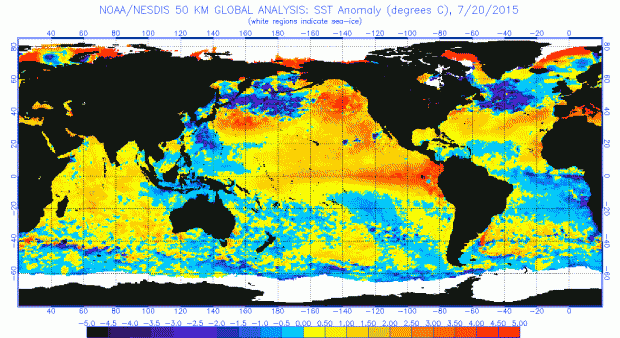
Figure 1. Sea Surface Temperature (SST) anomalies for July 20, 2015. NOAA/NESDIS.
So What About New Jersey?
What might this mean for New Jersey’s weather the remainder of this summer? The Office of the New Jersey State Climatologist has evaluated historical weather observations to see how past El Niño events have impacted seasonal temperature and precipitation. Time series of statewide temperature and precipitation for the summer season (June, July, and August) over the 63 years between 1951 and 2013 (figures 2 and 4 below) provide data to evaluate 18 El Niño summers during this period in comparison to the other years. The percentage of El Niño summers within the lower, middle and upper terciles (thirds) of the 63 summers are displayed in figures 3 (temperature) and 5 (precipitation) below. (This was done last summer as observations began to point toward a potential El Niño event; we have yet to update this with observations from summer 2014, which was not an El Niño summer, or look at impacts as a function of El Niño strength).
Summer Temperatures in New Jersey
Temperatures in New Jersey have a tendency to be cooler during El Niño summers, 39% of El Niño summers have temperatures falling within the lowest tercile, (below 71.4°F). 33% of El Niño summers fall within the middle tercile (between 71.4°F and 72.6°F), while 28% were recorded in the warmest tercile (above 72.6°F). Two of New Jersey’s coolest summers (within the bottom 10%) since 1951 occurred during an El Niño year. However, one of the warmest summers (top 10%) occurred during an El Niño year.
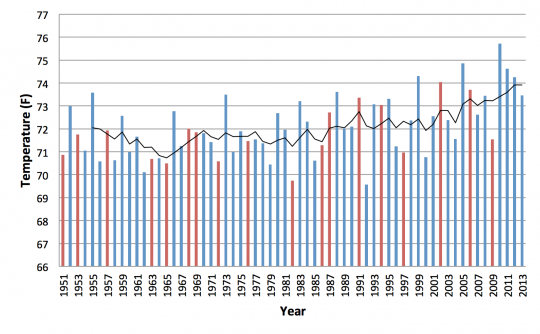
Figure 2. Time series of New Jersey average summer temperatures from 1951-2013. Red bars indicate years with an El Niño event. Black line indicates 5-year moving average.
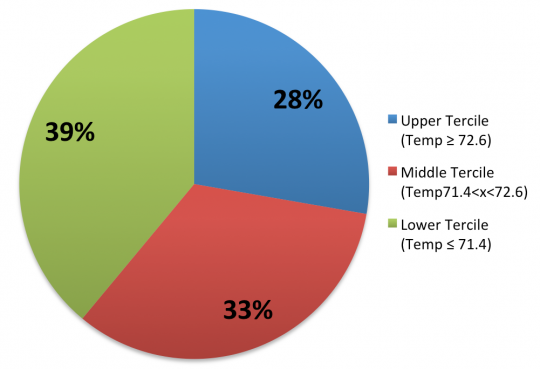
Figure 3. Distribution of average summer temperatures from 1951-2013, representing percentage of El Niño summers falling within each tercile.
Summer Precipitation in New Jersey
For precipitation, El Niño summers tend to stay close to average, with 45% of El Niño summers in the middle tercile of precipitation (between 3.67" and 4.70"). A third of these summers exhibit precipitation totals in the lowest tercile (below 3.67"), and only 22% of years have precipitation in the highest tercile. Two El Niño summers had such low precipitation amounts in New Jersey that they landed in the bottom 10% for the period, while one summer was in the top 10%.
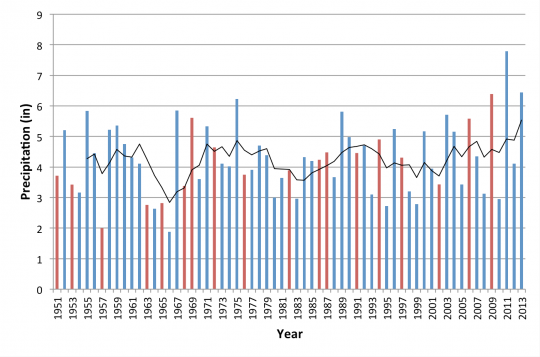
Figure 4. Time series of New Jersey total summer precipitation from 1951-2013. Red bars indicates years with an El Niño event. Black line indicates 5-year moving average.
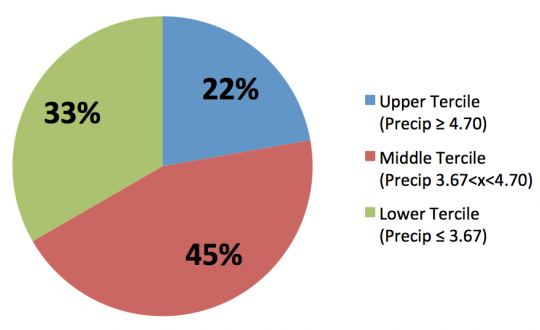
Figure 5. Distribution of total summer precipitation from 1951-2013, representing percentage of El Niño summers falling within each tercile.
Summary
No significant influence on NJ summer weather was found during El Niño years in comparison to other years. This is not surprising, as it is well understood that atmospheric connections between distant regions tend to be weaker in summer than other seasons. Nevertheless, we have found hints that New Jersey summers exhibit a tendency toward cooler than average temperatures and near-average precipitation compared to non-El Niño summers. With this summer (June-August) halfway through, temperatures have averaged very close to normal and precipitation somewhat above normal. It is also worth noting that El Niño periods tend to contribute to a reduction of tropical storm/hurricane development in the Atlantic Basin. This is reflected in the NWS Hurricane Center prediction for this hurricane season. However, even in a weak season, it only takes one storm to wreak havoc (witness Hurricane Andrew in 1992), so one should always keep an eye of the forecast and follow the action on NJWeather.org should New Jersey be threatened by a storm.
Further Reading
- Current Analysis - http://www.cpc.ncep.noaa.gov/products/precip/CWlink/MJO/enso.shtml
- A more in-depth explanation of El Niño - http://www.pmel.noaa.gov/tao/elnino/el-nino-story.html
- FAQ about the El Niño - http://www.cpc.ncep.noaa.gov/products/analysis_monitoring/ensostuff/ensofaq.shtml#ENSO
- More forecasting tools - http://iri.columbia.edu/our-expertise/climate/forecasts/enso/
Former ONJSC employee Dan Zarrow and intern Jack McCarty contributed to the original analysis and report, published May 30, 2014.


