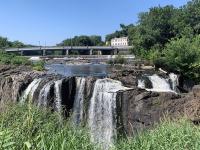
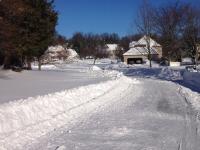
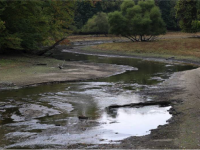
December Overview
The theme of “pressure” was selected to define the last month of 2024. In an absolute sense, this refers to a mid-December period with the highest atmospheric pressure recorded in New Jersey in over 40 years. It can also be linked with pressure differentials over the course of the month that resulted in many windy days. In a relative sense, it refers to the need to recoup the substantial precipitation deficit for the second half of the year in hopes that water resources will rebound, and by spring, drought will not be of great concern. Some progress in that direction was made from late November through December, but far more is needed in upcoming months. Following a recap of December conditions, this report will conclude with an overview of the Garden State’s weather/climate of 2024, including a link to our annual top 10 event list.
Statewide, December precipitation was more plentiful than any month since August, though still below the 1991–2020 normal. The rain and melted snow averaged 3.67” (Figure 1). This was 0.60” below normal and ranks as the 65th driest (66th wettest) since statewide records commenced in 1895. It is important to note that monthly totals in this report do not include rain that fell across NJ during the evening of the 31st. Convention is to record any end-of-month (or year, in this case) precipitation after the morning observation times for NWS Cooperative and Community Collaborative Rain, Hail, and Snow Network (CoCoRaHS) stations as falling on the next calendar day.
As seen most often throughout 2024, south Jersey was drier than the north in December. The southern climate division (Mercer/Middlesex/Monmouth south, except east of the Garden State Parkway) averaged 3.55” (-0.73”, 63rd driest/68th wettest), the coastal division (east of the Parkway) came in at 3.21” (-1.15, 55th driest/76th wettest), and the northern division (Hunterdon/Somerset/Union and north) averaged 3.92” (-0.33”, 70th driest/61st wettest).
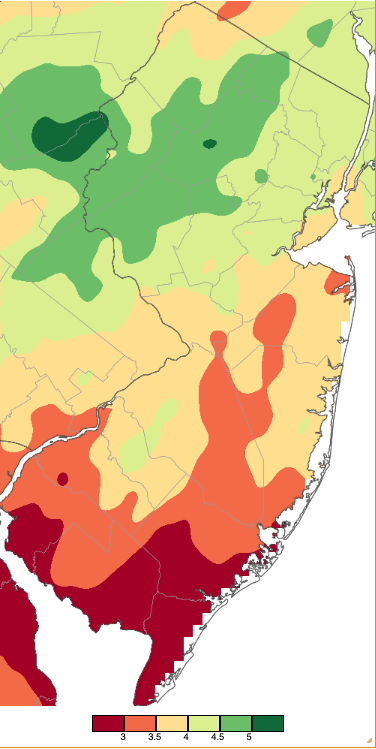
Figure 1. December 2024 precipitation across New Jersey based on a PRISM (Oregon State University) analysis generated using NWS Cooperative, CoCoRaHS, NJWxNet, and other professional weather station observations from approximately 7 AM on November 30th to 7 AM on December 31st. Note the scale in inches at the bottom of the map. Totals range from 2.50”–2.99” (dark red) to 5.00”–5.49” (dark green).
Statewide, December snowfall averaged 3.1”. This was 1.2” below normal and ranks as the 62nd least snowy (69th snowiest) since 1895. The northern snow division (Warren/Morris/Essex/Hudson northward) averaged 6.5” (+0.4”, 58th snowiest), the central snow division (Hunterdon/Mercer/Somerset/Union/Middlesex/Monmouth) averaged 4.6” (-0.2”, 56th snowiest), and the southern snow division (Burlington/Ocean southward) averaged 0.6” (-2.4”, 48th least snowy/84th snowiest).
December temperatures averaged 35.0° across the state. This was 1.6° below normal and ranks as the 75th coldest/54th warmest. It was the first month of 2024 that was below normal, the last being November 2023. The average high temperature was 43.8° (-1.2°, 78th coldest/52nd warmest) and the average low temperature was 26.1° (-2.1°, 71st coldest/56th warmest). The north came in at 31.6° (-2.5°, 63rd coldest/67th warmest). The south averaged 36.9° (-1.2°, 81st coldest/49th warmest). The coast averaged 38.0° (-1.1°, 82nd coldest/49th warmest).
Precipitation and Storms
Wetter locations in the north had close to twice the monthly precipitation of the driest southern spots. Holland Township (Hunterdon) was wettest with 5.28”, followed by Greenwich Township (Warren) 5.16”, Denville Township (Morris) 5.13”, Lebanon (Hunterdon) 5.10”, Mine Hill Township (Morris) 5.07”, and Knowlton Township (Warren) 5.02”. West Cape May (Cape May) saw the least precipitation with 2.17”, followed by Fortescue (Cumberland) 2.29”, Dennis (Cape May) 2.41”, Lower Alloways Creek Township (Salem) 2.46”, Lower Township (Cape May) 2.54”, 2.54”, 2.65”, 2.68” (four stations), and Ocean City (Cape May) 2.57”.
Top reporting locations for monthly snowfall included Mine Hill Township at 10.5”, Mount Olive Township (Morris) 10.2”, Montague Township (Sussex) 9.9”, Sparta Township (Sussex) 9.2”, and Mount Arlington (Morris) and Jefferson Township (Morris) each with 9.0”.
The first event of the month was a rather minor one that brought light snow accumulations to the north, rain and snow showers further south, and was accompanied and followed by three days with winds gusting over 40 mph. This was the first sign of a month where atmospheric pressure differentials generated frequent windy conditions. Precipitation began in the late afternoon and evening of the 4th, with snow accumulating during the overnight hours of the 5th, followed by some morning flurries and a few snow squalls. Precipitation was meager, at best reaching 0.21” at Wall Township and 0.19” in both Neptune City and Neptune Township (all in Monmouth). Four counties in the northwest received an inch or more of snow, topped by 2.2” in Holland Township and 2.0” in Randolph Township (Morris). Winds on the 4th gusted to 42 mph at Atlantic City Marina (Atlantic) and Logan Township (Gloucester), and 40 mph in Little Egg Harbor Township (Ocean). A windy day followed on the 5th with gusts to 54 mph at both Little Egg Harbor Township and Lower Alloways Creek Township, Seaside Heights (Ocean) 53 mph, Fortescue 50 mph, and 15 other Rutgers NJ Weather Network stations from 41–49 mph (Figure 2). As conditions calmed on the 6th, High Point Monument (Sussex) still gusted to 47 mph, Wantage Township (Sussex) 44 mph, and Vernon Township (Sussex) 41 mph.
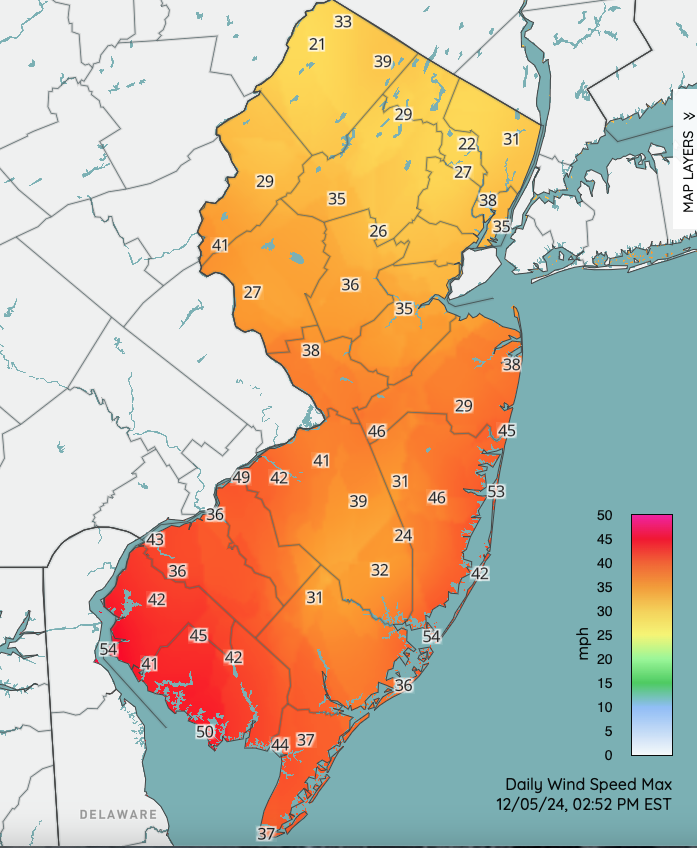
Figure 2. Peak daily wind gusts at NJWxNet stations as of mid-afternoon on December 5th. These proved to be maximum values for the entire day.
Next up was afternoon rain on the 9th that amounted to no more than 0.45” at Sparta Township, Hackettstown (Warren), and Knowlton Township. More plentiful evening rain on the 10th brought 0.87” to Point Pleasant Beach (Ocean), Beachwood (Ocean) 0.80”, and Wall Township, Chatham (Morris), and Wayne Township (Passaic) all with 0.79”.
This rather active pattern ramped up further on the 11th, with late morning to evening rain and, again, some strong winds. Holland Township saw 1.98”, Sparta Township 1.85”, Newton (Sussex) 1.80”, and Lafayette Township (Sussex) 1.76”. Of 264 CoCoRaHS reports, 84 reported 1.00” –1.98”, with the remainder of the state catching 0.50”–0.99” (Figure 3). This storm had the lowest pressures of the month, ranging from 29.35”–29.45”. This led to wind gusts on the 11th reaching 50 mph at Wantage Township and 41–47 mph at seven other NJWxNet locations. As the low began to be replaced by an exceptional ridge of high pressure, the 12th saw Lower Alloways Creek Township gusting to 45 mph and four stations from 40–43 mph. The ridge brought pressures of 30.90”–31.00” on the 14th (Figure 4). This not only was the highest for the month but was the state’s highest pressure since February 13, 1981, when a record 31.10” level was reached.
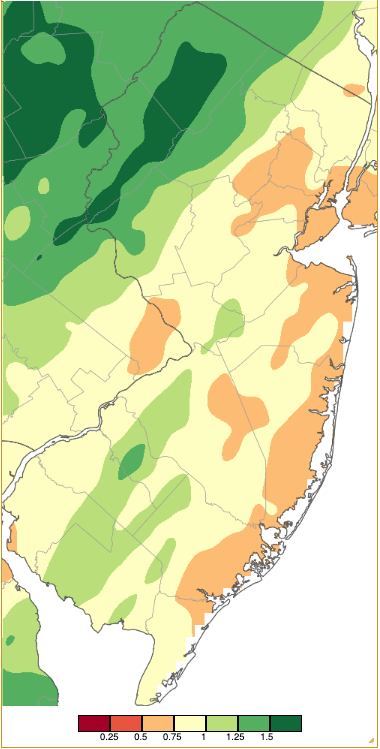
Figure 3. Precipitation across New Jersey from 7 AM on December 11th through 7 AM December 12th based on a PRISM (Oregon State University) analysis generated using NWS Cooperative, CoCoRaHS, NJWxNet, and other professional weather station observations. Totals range from 0.00”–0.25” (dark red) to 1.50”–1.75” (dark green).
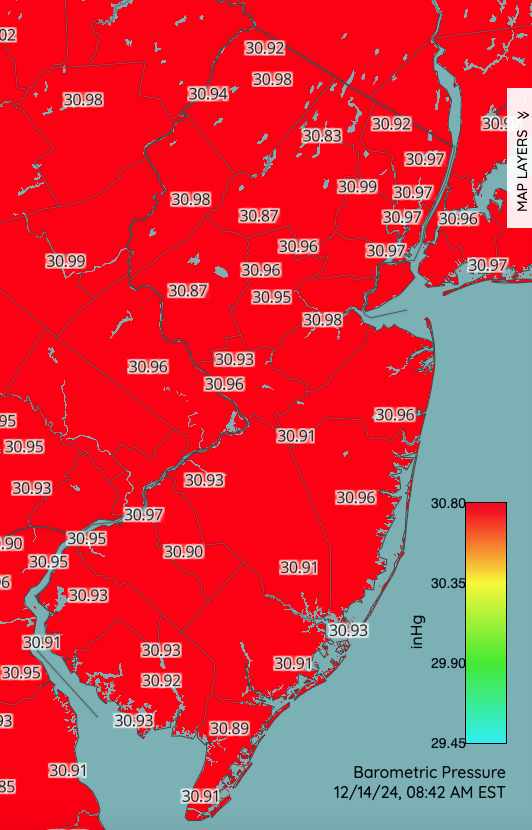
Figure 4. Barometric pressure (inches of mercury) at 8:42 AM on December 14. Observations are within 0.10” of their maximum for this episode. Observations from NJWxNet, Delaware Environmental Observing System, and National Weather Service Automated Surface Observing System stations.
As the ridge dissipated, another storm began to invade the region, with rain moving into NJ during the evening of the 15th and some snow in the north. Most of the precipitation ended early on the 16th though light rain and drizzle continued to early on the 17th. Rainfall totals were as high as 1.48” in Berkeley Township (Ocean), Ocean Gate (Ocean) 1.43”, Wall Township 1.35”, and Beachwood 1.33”. Of 260 reports, 73 were from 1.00”–1.48”, with the remainder from 0.48” (Harding Township) to 0.99” (Figure 5). Some stations in five counties caught at least an inch of snow. This included Wantage Township 4.2”, Green Pond (Morris) 4.1”, Hardwick Township (Warren) 3.0”, West Milford Township (Passaic) 2.6”, and Oakland (Bergen) 1.0”.
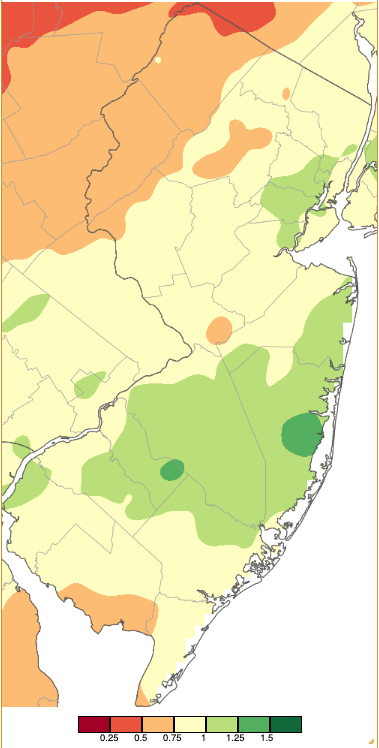
Figure 5. Precipitation across New Jersey from 7 AM on December 15th through 7 AM December 17th based on a PRISM (Oregon State University) analysis generated using NWS Cooperative, CoCoRaHS, NJWxNet, and other professional weather station observations. As in Figure 3, totals range from 0.00”–0.25” (dark red) to 1.50”–1.75” (dark green).
While not producing the moisture of the previous three events, a modest storm on the 20th into the 21st brought the most snow of the month to the northern two thirds of NJ. This event was followed by subfreezing temperatures and a minor snowfall on the 24th to ensure the first white Christmas since 2009 over central and northern areas (defined as an inch or more of snow covering the ground on Christmas morning). Rain and melted snow from the daytime hours of the 20th ending before dawn on the 21st amounted to as much as 0.48” at Barnegat Light (Ocean), Vernon Township 0.47”, and Greenwich Township (Warren) 0.45”. Fifteen of NJ’s 21 counties had stations reporting 1.0” or more snowfall, nine with as much or more than 4.0” (Figure 6). Sparta Township and Washington Township (Warren) topped the chart, each receiving 5.5” (Table 1). Wind gusts on the 21st reached 43 mph at High Point Monument, Lower Alloways Creek Township 41 mph, and Seaside Heights 40 mph.
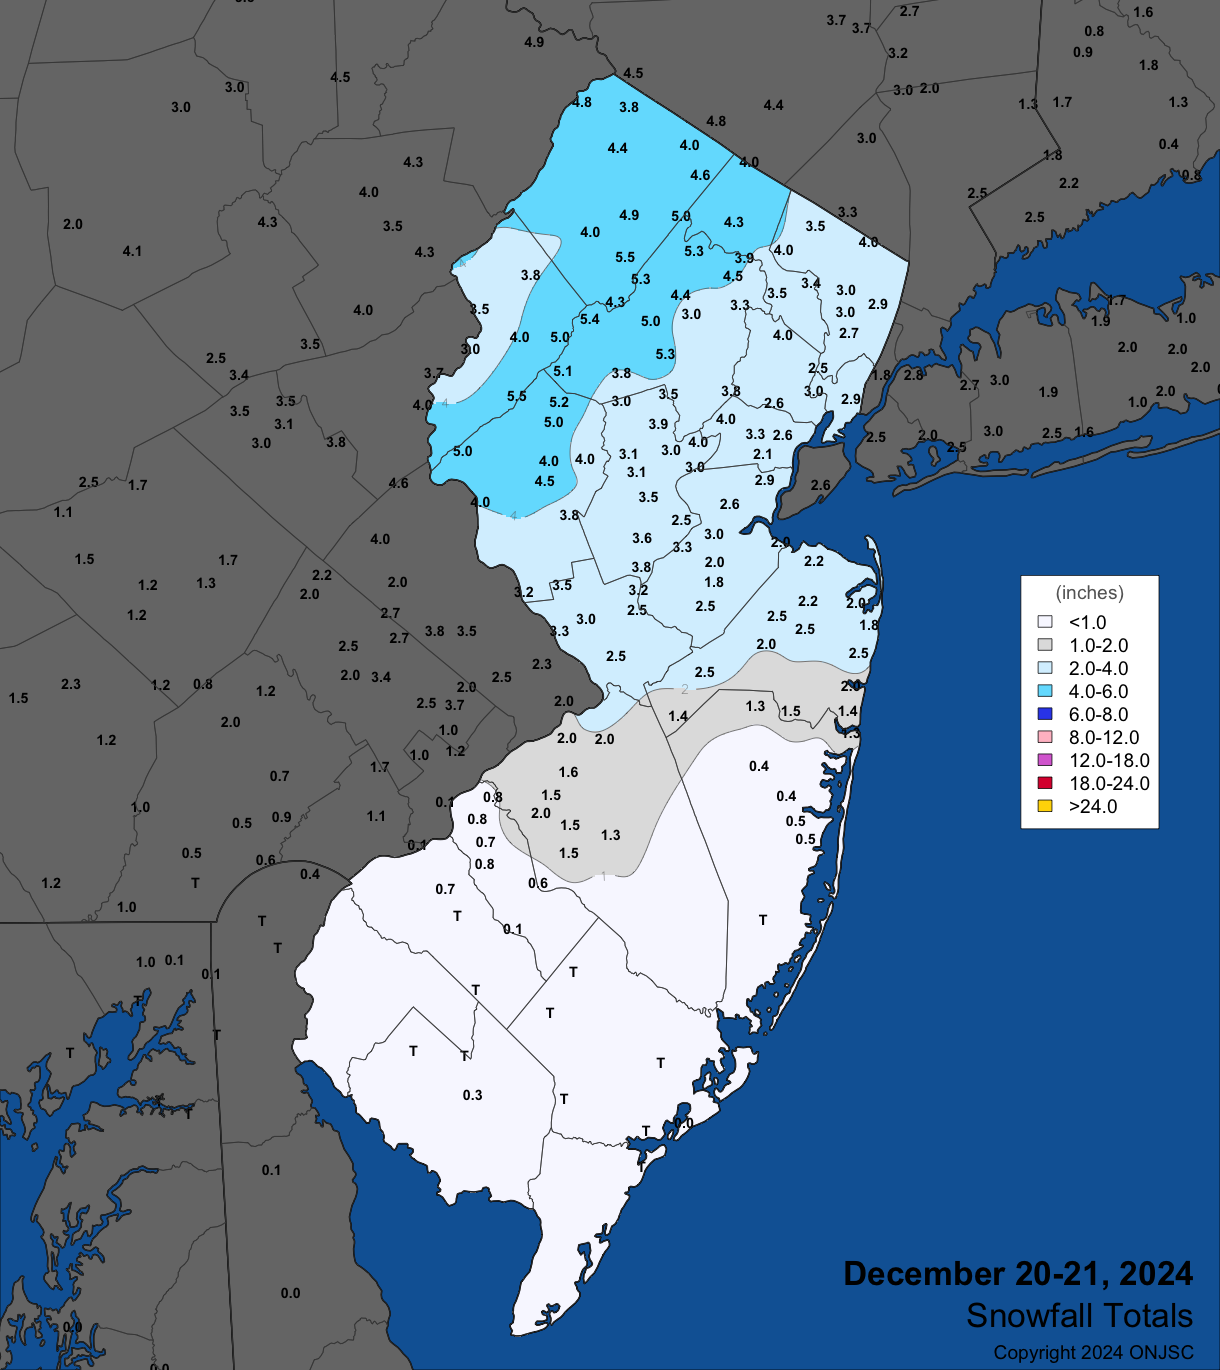
Figure 6. Snowfall from December 20th through the morning of December 21st. Observations are from CoCoRaHS, NWS Cooperative Observer, and NWS Spotter reports.
| County | Location | Snowfall |
|---|---|---|
| Bergen | Oakland & River Vale | 4.0” |
| Essex | Cedar Grove & West Caldwell Township | 4.0” |
| Hunterdon | Califon | 5.2” |
| Morris | Mount Olive Township | 5.4” |
| Passaic | West Milford Township | 4.3” |
| Somerset | Branchburg Township & Watchung | 4.0” |
| Sussex | Sparta Township | 5.5” |
| Union | New Providence | 4.0” |
| Warren | Washington Township | 5.5” |
Table 1. Maximum snowfall for the December 20th–21st event in counties where at least 4.0” fell. Observations are from CoCoRaHS, NWS Cooperative Observer, and NWS Spotter reports.
The aforementioned snow on the 24th fell surrounding the morning observation period. This burst of snow produced as much as 2.0” in both Wayne Township and Liberty Township (Warren), with many locations in central and northern counties catching 0.5”–1.5”. Liquid equivalents were mostly from 0.05”–0.10”.
Yet another modest system contributed moisture to the state from late on the 27th into the afternoon of the 28th, then resuming lightly early on the 29th. Some freezing rain occurred in colder locations at the onset of the event. Totals were highest in central areas, amounting to as much as 1.02” in Princeton (Mercer), Clark Township (Union) 1.01”, and Woodbridge Township (Middlesex) 1.00”. 157 CoCoRaHS reports were from 0.50”–0.99”, with Wildwood Crest (Cape May) seeing just 0.14” (Figure 7).
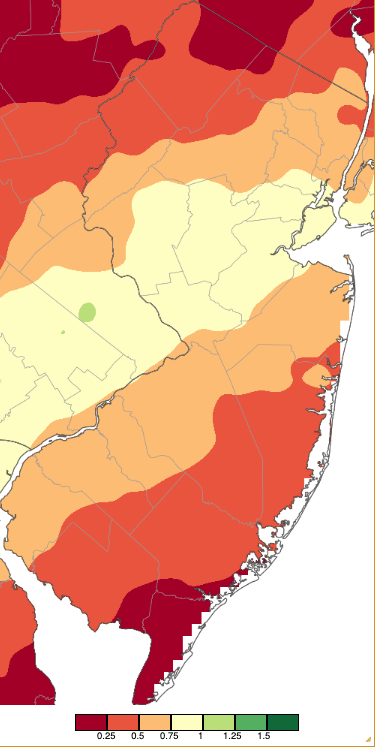
Figure 7. Precipitation across New Jersey on December 27th through December 29th based on data collected from NWS Cooperative, CoCoRaHS, and NJWxNet weather station observations. As in Figures 3 and 5, totals range from 0.00”–0.25” (dark red) to 1.50”–1.75” (dark green).
The modest event theme continued when, from late on the 29th to the predawn of the 30th, rain accumulated to as much as 0.98” in Knowlton Township, Rockaway Township (Morris) 0.81” and 0.72”, Denville Township (Morris) 0.79”, and Boonton (Morris) 0.76”. Most of the state received less than 0.50”.
The final event of the month occurred during the evening of the 31st, ending statewide before midnight. As mentioned previously, the precipitation that fell counts toward January 1, 2025, totals but it is worth discussing the episode in this month’s narrative. This quick-hitting storm was noteworthy as it included widespread lightning and some pea-size hail in the southern half of the state, strong wind, and over 0.50” of rain to some locations. Barnegat Light reported 1.27”, Harrison (Hudson) 0.72”, Little Egg Harbor Township 0.72”, and Colts Neck Township (Monmouth) 0.70”. Damage reports were received by the NWS due to strong winds in Clayton (Gloucester), and for the 7th day this month, 40 mph or greater gusts at NJWxNet stations reached 49 mph in Fortescue and 45 mph in Mannington Township (Salem). Quite an unusual way to ring out 2024!
The rain and snow of late November and especially throughout December helped to put a dent into drought conditions across New Jersey. However, it is important to appreciate that not nearly enough precipitation has yet been received to fully ameliorate drought anywhere and a Drought Warning issued by the NJ Department of Environmental Protection remains in place. The December 31st US Drought Monitor shows mostly Moderate Drought (D1) in the north, where Severe Drought (D2) had prevailed weeks earlier. Most of the south had been in Extreme Drought (D3) through much of December, but by month’s end the northern and western portions of the south had improved to D2. Meanwhile, lower rainfall totals and ongoing low ground water and streamflow levels kept the southeast mired in D3. This is the area that first began suffering from dry conditions back in summer.
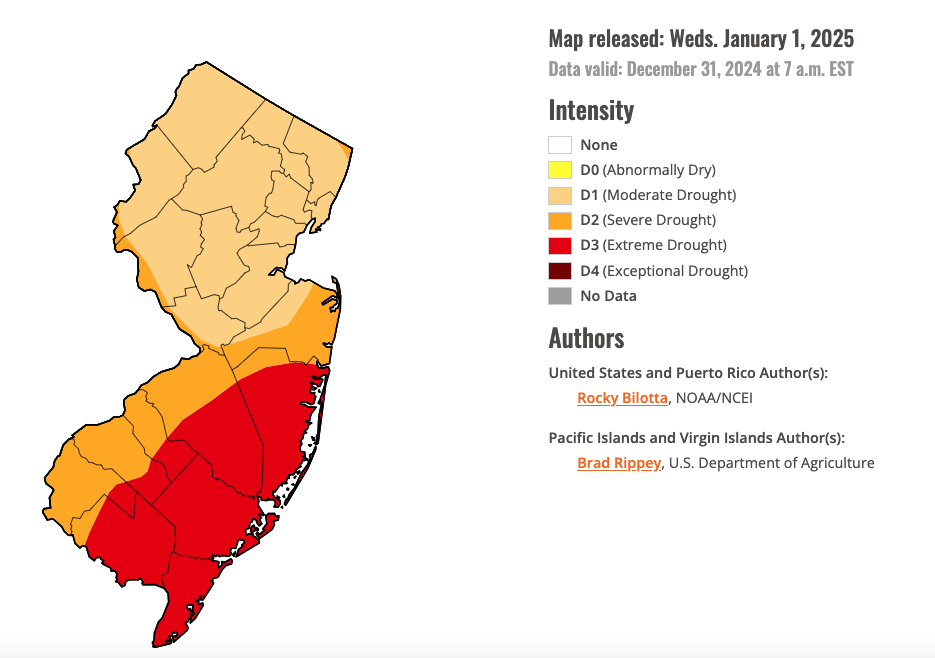
Figure 8. U.S. Drought Monitor map of conditions in NJ as of December 31, 2024.
Temperature
As the month started off on the cold side and the mildest day was not achieved until the 29th, this section of the report will start off discussing daily December minimum temperatures. There were 18 days when each of the 69 NJWxNet stations fell to the freezing point. This included the first seven days, right on the heels of the first such day of the season on November 30th. There were 13 days when the low at one or more NJWxNet stations dipped to 15° or lower. Single digits above or below zero were reached on eight of them. The 1st saw Hopewell Township (Mercer) down to 13°. On the 2nd, Walpack (Sussex) was 9° with 13 other stations from 10°–15°. Walpack reached 10° on the 4th with 11 stations from 12°–15°.
Cold air returned on the 13th with Walpack again at 10°. A season-to-date low of 5° was reached at Walpack on the 14th with four stations at 9° and 13 from 10°–15°. Meanwhile, the 28° low at four coastal stations was 23° milder than Walpack. Walpack was 8° and ten stations form 11°–15° on the 15th. Following another break, there were seven consecutive days with lows below 15°, beginning on the 21st with High Point Monument at 6°, High Point (Sussex) 9°, and 13 sites from 10°–15°. The coldest air at the higher elevation sites was indicative of cold air advecting into NJ. Sure enough, the next day, the 22nd, found the first subzero readings of the season with Walpack at -2°, High Point Monument and Sandyston (Sussex) each -1°, 27 stations from 1°–10°, and 29 from 11°–15°. The coldest morning of December proved to be the coldest of 2024 when the 23rd brought lows of -8° at Walpack, Sandyston -7°, nine sites at -5° to -1°, 47 from 0°–10°, and 10 from 11°–15°. Of the 69 NJWxNet stations, Harvey Cedars (Ocean) was “mildest” at 16° (Figure 9).
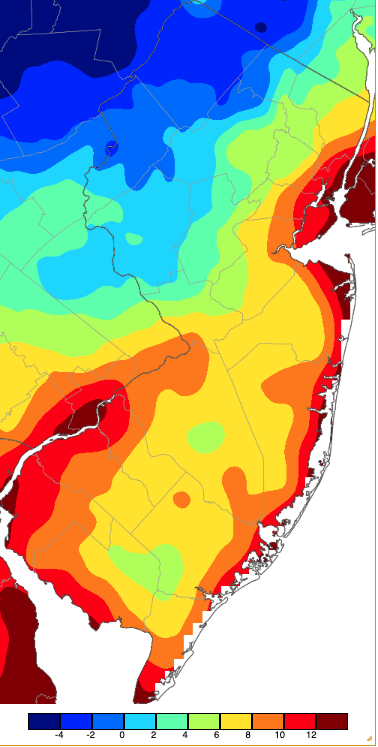
Figure 9. Minimum temperatures on December 23rd based on a PRISM (Oregon State University) analysis generated using NWS, NJWxNet, and other professional weather stations. Note the 2° scale beneath the map.
On the 24th, clear skies in the south and insulating cloud cover in the north resulted in the coldest low of 14° being reached at both inland southern Woodbine (Cape May) and Vineland (Cumberland), though along the Delaware Bay coast, Fortescue was mildest in NJ at 32°. Sandyston fell to 10° on the 25th, with seven locations from 11°–15°. The 26th found Walpack down to 3°, Sandyston 4°, and 15 stations from 7°–15°, while five locations dropped to just 29°, 26° milder than the coldest location. The range in lows expanded to 28° on the 27th when Walpack was 7° and Atlantic City Marina 35°, while twelve stations fell to 8°–15°. Mild air finished the month when the 29th was the only December day with none of the 69 NJWxNet stations falling to or below freezing. This contrasts with the 22nd, the only day when the maximum at every station failed to exceed 32°.
As for daily maximum temperatures, there were eleven December days where highs at one or more NJWxNet station reached or exceeded 55°. The first grouping of such began on the 8th, with Red Lion (Burlington) at 60° and 43 stations from 55°–59°. Vineland touched 60° on the 9th, with 21 sites 55°–59°. Mannington and Vineland reached 62° on the 10th, with 33 stations from 55°–61°. The 11th was the second mildest December day, when seven stations topped out at 66°, 47 from 60°–65°, and 15 from 55°–59°.
The 16th saw Oswego Lake (Burlington) at 57°. Atlantic City Marina reached 62° on the 17th, with 61 stations from 55°–61°. Four stations reached 59° on the 18th, with 40 tightly packed from 55°–58°. A mild final four days of the year began with six stations at 57° on the 28th. This was followed by the warmest December 2024 day on the 29th when 68° highs were achieved at Hammonton (Atlantic), Mansfield (Burlington), Piney Hollow (Gloucester), and West Deptford (Gloucester). 45 stations topped out from 60°–67°, and 17 from 55°–59° (Figure 10). Interestingly, the two coolest stations, High Point Monument and West Cape May, each at 52°, are the two furthest apart in the NJWxNet. The 30th brought a high of 60° to eleven locations and 55°–59° to 56 others. Only Fortescue was cooler at 52°. Mannington reached 60° and 37 stations 55°–59° on the 31st.
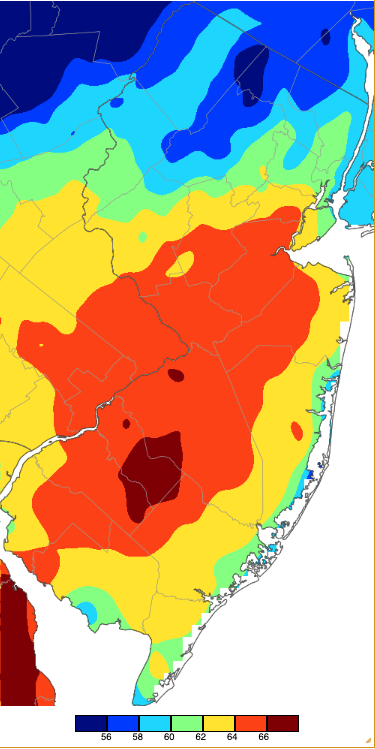
Figure 10. Maximum temperatures on December 29th based on a PRISM (Oregon State University) analysis generated using NWS, NJWxNet, and other professional weather stations.
Annual 2024 Overview
For our annual ranking of the top 10 weather/climate occurrences of 2024, visit here. Below, temperature and precipitation conditions across NJ are recapped for the past year.
Statewide annual precipitation averaged 42.52”, which is 5.04” below the 1991–2020 normal and ranks as the 45th driest (86th wettest) since 1895 (Figure 11). Eight months had below-normal precipitation, including the 3rd driest September and the driest October (the driest of any month of the past 130 years). Fall was the driest on record. Of the four above-average months, January ranked 7th wettest and March 3rd wettest. There was a difference in annual precipitation between northern and southern NJ. The northern climate division averaged 45.22” (-3.50”, 55th driest of 130 years), the southern division 40.82” (-6.06”, 39th driest), and the coastal division 41.79” (-4.79”, 46th driest).
Annual precipitation at individual CoCoRaHS stations reached a maximum of 59.36” at Mine Hill Township (Morris), Mount Arlington (Morris) 59.18”, Chatham (Morris) 58.10”, Jefferson Township (Morris) 57.30”, Little Falls Township (Passaic) 55.97”, and Madison (Morris) 55.28”. The driest location was Upper Deerfield (Cumberland) at 36.63”, followed by Ocean City (Cape May) 36.85”, Lower Township (Cape May) 38.02” and 38.60” (two stations), Franklin Township (Gloucester) 38.19”, and Hamilton Township (Atlantic) 39.31”.
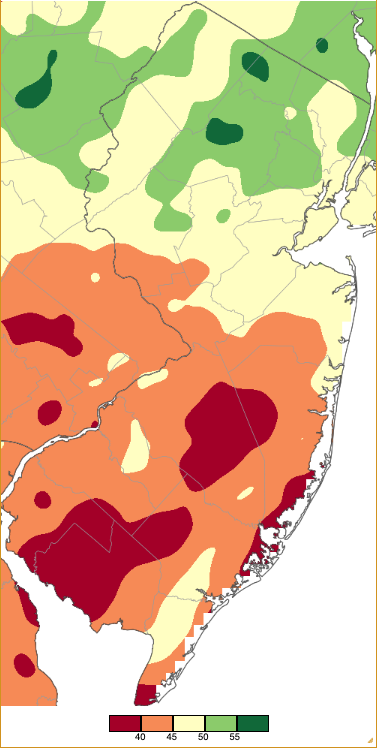
Figure 11. Annual 2024 precipitation across New Jersey based on a PRISM (Oregon State University) analysis generated using NWS Cooperative, CoCoRaHS, and NJWxNet weather station observations. NJ totals ranged from 35.00”–39.99” (red) to 55.00”–59.99” (dark green).
There was a notable disparity of precipitation between the first and second halves of the year. Most of NJ received an above normal 25”–30” from January–June (Figure 12). From July–December, precipitation totals were 15”–25” in the north and 10”–20” in the south (Figure 13). These below-average second-half totals, especially in the fall (but becoming notable in the south during the summer), resulted in the NJ Department of Environmental Protection issuing a statewide Drought Watch on October 17th, which was upgraded to a Drought Warning on November 13th. Despite some late-November and December improvement, the warning remains in effect at year’s end. During late fall, the US Drought Monitor reported D3 (extreme drought) in NJ for the first time since 2002. At one time, D3 covered most of south Jersey while the north reached D2 (severe).
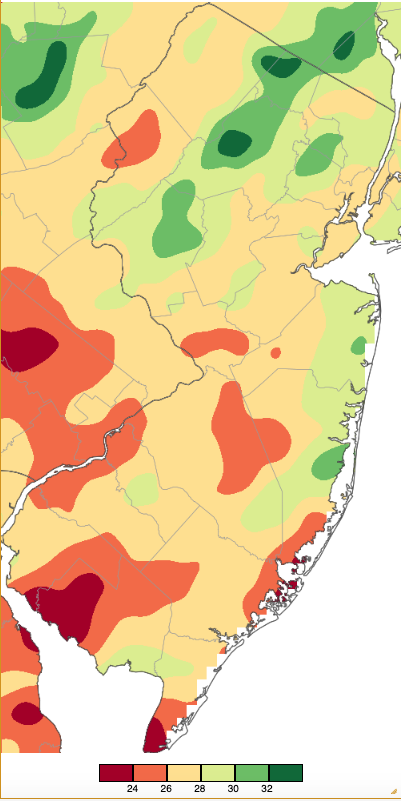
Figure 12. January–June 2024 precipitation across New Jersey based on a PRISM (Oregon State University) analysis generated using NWS Cooperative, CoCoRaHS, and NJWxNet weather station observations. NJ totals ranged from 10.00”–14.99” (red) to 30.00”–34.99” (dark green).
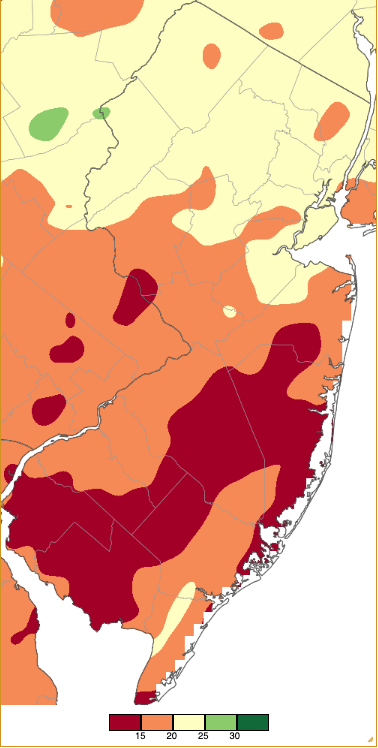
Figure 13. July–December 2024 precipitation across New Jersey based on a PRISM (Oregon State University) analysis generated using NWS Cooperative, CoCoRaHS, and NJWxNet weather station observations. As in Figure 12, NJ totals ranged from 10.00”–14.99” (red) to 30.00”–34.99” (dark green).
The statewide average 2024 temperature of 55.8° was 2.2° above the 1991–2020 normal and ranks as the 2nd warmest year since 1895 (Table 2). Nine of the ten warmest years have occurred since 2006, with four of the top six in the past five years. Eleven months were above average, and four of them ranked in the top 10 for warmth. Every season ranked from 3rd to 6th warmest. The average annual maximum of 65.8° was 2.3° above average, ranking as the warmest on record. The average minimum of 45.7° was 2.1° above average, ranking 3rd warmest. The northern climate division averaged 53.9° (+2.4°, 2nd warmest), the southern division 56.9° (+2.1°, 2nd warmest), and coastal division 56.8° (+1.9°, 4th warmest).
| Rank | Year | Annual Avg. Temp. |
|---|---|---|
| 1 | 2012 | 55.9° |
| 2 | 2024 | 55.8° |
| 3 | 2023 | 55.6° |
| 4 | 2020 | 55.5° |
| 5 | 1998 | 55.2° |
| 6 | 2021 | 55.1° |
| 7 | 2016 | 55.0° |
| 7 | 2006 | 55.0° |
| 9 | 2011 | 54.9° |
| 10 | 2010 | 57.7° |
Table 2. The ten mildest years across NJ since 1895.
The highest daily maximum temperatures of the year at stations throughout NJ and adjacent areas were used to generate Figure 14. The map does not depict temperatures occurring on a single day, rather it displays the highest temperatures achieved on the hottest day during the year for a given location, based on dozens of stations. It shows that the entire state made it to 90° or higher at least once during the year. The highest temperature in NJ in 2024 was 101° at Cream Ridge (Monmouth), Hamilton (Mercer), Teterboro Airport (Bergen), and Harrison on July 16th.
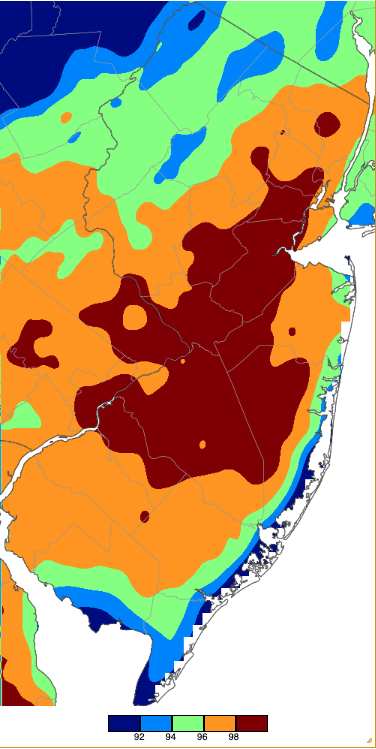
Figure 14. Annual maximum temperatures across NJ during 2024 based on a PRISM (Oregon State University) analysis generated using NWS, NJWxNet, and other professional weather stations.
The lowest daily maximum (high) temperatures of the year are mapped in Figure 15. Areas in the northwest saw minimum highs in the teens, rising in a general latitudinal pattern where the far south had their coldest day in the mid 20°s.
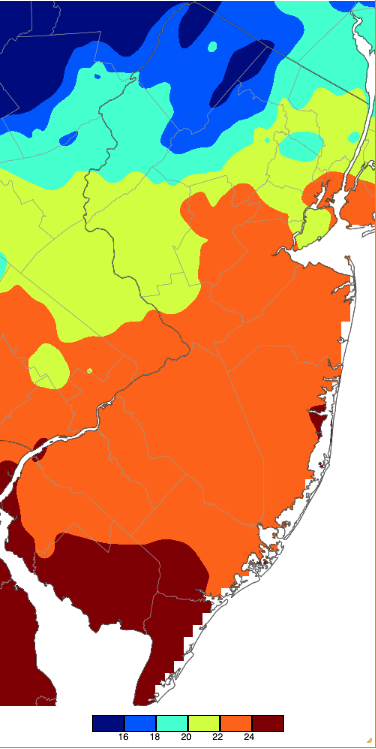
Figure 15. Annual minimum maximum temperatures across NJ during 2024 based on a PRISM (Oregon State University) analysis generated using NWS, NJWxNet, and other professional weather stations.
The coldest temperatures of the year are depicted in Figure 16. This is an identical map to that earlier in this report for December (Figure 9), as everywhere in NJ reached an annual low on December 23rd. The northwest experienced lows near or below zero, coastal and urban areas bottomed out between 10°–14°, and the interior northeast, central, and interior southern areas were between 4°–10°. The coldest temperature in NJ in 2024 was -8° at Walpack on the 23rd.
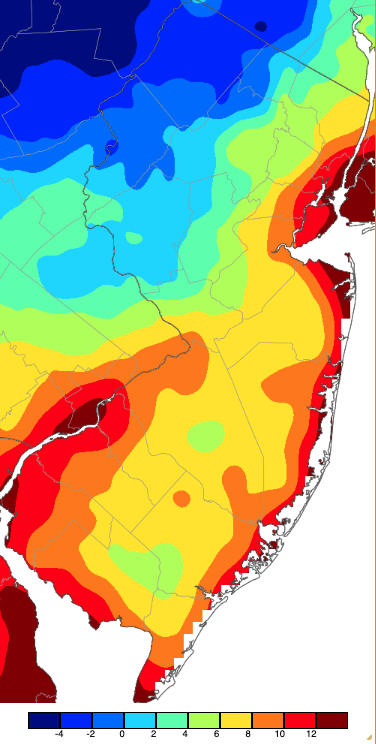
Figure 16. Annual minimum temperatures across NJ during 2024 based on a PRISM (Oregon State University) analysis generated using NWS, NJWxNet, and other professional weather stations.
The maximum minimum (low) temperatures mapped in Figure 17 are between 70° and 74° in the northwest. They rise to 74°–78° over most of the remainder of the state, except are from 78°–82° in the urban northeast and along the Delaware River and Delaware Bay coasts.
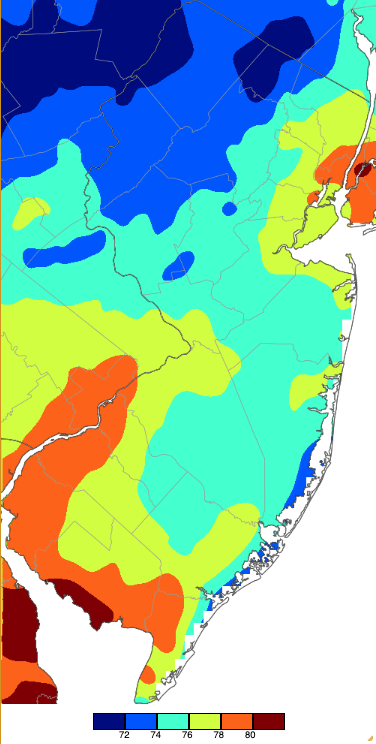
Figure 17. Annual maximum minimum temperatures across NJ during 2024 based on a PRISM (Oregon State University) analysis generated using NWS, NJWxNet, and other professional weather stations.


