Overview
Fall and spring months are considered to be seasonal transition ones. At times, the change of season takes place rather slowly. Then there are months like this past September when the turn is quite abrupt. September 2023 began with the hottest day and week of 2023. Several rainy periods, some with severe storms, ensued as temperatures began to decline and Hurricane Lee, while remaining far offshore, brought rough surf and some clouds to NJ. Soon after came chilly conditions with the remnants of Tropical Storm Ophelia twice bringing heavy rain into portions of the state and over a week of minor to occasional moderate coastal flooding at times of high tide.
Statewide, the average temperature of 68.1° was 1.2° above the 1991–2020 normal. This ranked as the 16th warmest September since records commenced in 1895. The average high temperature was 77.4°, which 0.2° above normal and ranks 35th warmest. The average low temperature of 58.8° was 2.2° above normal, ranking 8th warmest. The northern climate division averaged 65.8° above (+0.9°, 21st warmest), southern +69.5° (+1.4°, 14th warmest), and coastal 69.9° above (+1.2°, 14th warmest).
September rainfall was excessive, with the southwest and northwest the driest regions of the state yet averaging above the statewide 30-year normal. The wettest area was along the northern coast with rainfall as much as 3 to 4 times above the climatological mean (Figure 1). Statewide, September precipitation averaged 7.55”, which is 3.39” above normal and ranks as the 9th wettest (Table 1). The northern division averaged 7.73” (+3.27”, 11th wettest), southern 7.38” (+3.39”, 11th wettest), and coastal 8.01” (+4.12”, 3rd wettest).
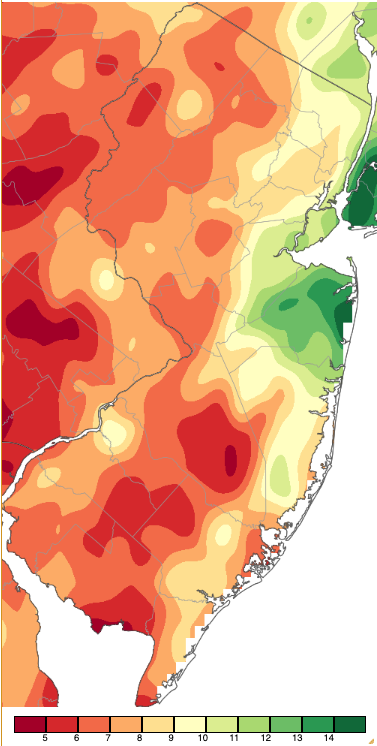
Figure 1. September 2023 precipitation across New Jersey based on a PRISM (Oregon State University) analysis generated using NWS Cooperative, CoCoRaHS, NJWxNet, and other professional weather station observations from approximately 8 AM on August 31st to 8 AM on September 30th. Note the scale in inches at the bottom of the map. Totals range from 4.00”–4.99” (dark red) to 14.00”–15.99” (dark green).
| Rank | Year | Sept. Avg. Precip. |
|---|---|---|
| 1 | 1999 | 9.50” |
| 2 | 1938 | 9.38” |
| 3 | 1934 | 8.41” |
| 4 | 1975 | 8.05” |
| 5 | 1907 | 8.03” |
| 6 | 1960 | 7.60” |
| 7 | 2018 | 7.57” |
| 7 | 1966 | 7.57” |
| 9 | 2023 | 7.55” |
| 10 | 1944 | 7.41” |
Table 1. The 10 wettest Septembers across NJ since 1895.
Precipitation and Storms
Monmouth stole the show as the wettest county in September. Top station totals for the state, all in this county, included Bradley Beach 17.47”, Neptune 16.34” and 15.29” (two stations), Long Branch 15.84”, Ocean Township 15.49”, Oceanport 14.82”, Eatontown 14.51”, and Freehold 14.09”. Ramsey (Bergen) topped all other counties with 13.10”. On the driest (but still above normal) side were Winslow Township (Camden) and Blairstown (Warren) each at 4.93”, followed by Franklin Township (Gloucester) 5.00”, Stillwater (Sussex) 5.33”, Evesham (Burlington) 5.44”, and 5.48” at both Galloway Township (Atlantic) and Hammonton (Atlantic).
As the early-month heat dissipated, showers and thunderstorms roamed northeast NJ during the morning and afternoon of the 8th. In Bergen County, River Vale received 3.20”, Haworth 3.23”, River Edge and Maywood each 2.38”, and Montvale 2.26”. Thirty-one northern stations in the CoCoRaHS program received 1.00”–1.99”. A wind gust of 66 mph was recorded at Teterboro Airport (Bergen), with gusts to to 40 mph at the Rutgers NJ Weather Network stations in Lyndhurst (Bergen), Haworth, and Lower Alloways Creek Township (Salem). Damage was reported to trees, power lines, and vehicles in seven central and northern counties and to planes at Morristown Airport (Morris). Hail, some up to an inch in diameter, was reported in Bergen, Morris, and Hunterdon counties.
The following days saw more thunderstorms pop up, some severe in central locations on the 9th into the morning of the 10th. Storms resumed later in the day, with areas of heavy rain in northern and central areas and later moving into the southwest, ending late on the 11th. Hefty totals included Haddon Heights (Camden) with 7.27”, Manalapan (Monmouth) 5.97”, Mount Ephraim (Camden) 5.35”, Greenwich (Cumberland) 5.07”, Barrington (Camden) 4.91”, and three Freehold stations at 4.47”, 4.34”, and 4.18”. Of 270 CoCoRaHS reports, 17 were from 3.00”–3.99”, 56 from 2.00”–2.99”, and 115 from 1.00”–1.99” (Figure 2). Hail up to an inch in diameter fell on the 9th in Middlesex, Morris, and Sussex counties. A wind gust of 42 mph also occurred at West Deptford (Gloucester) on the 9th, with damage to trees and power lines in seven counties stretching from Ocean to Sussex.
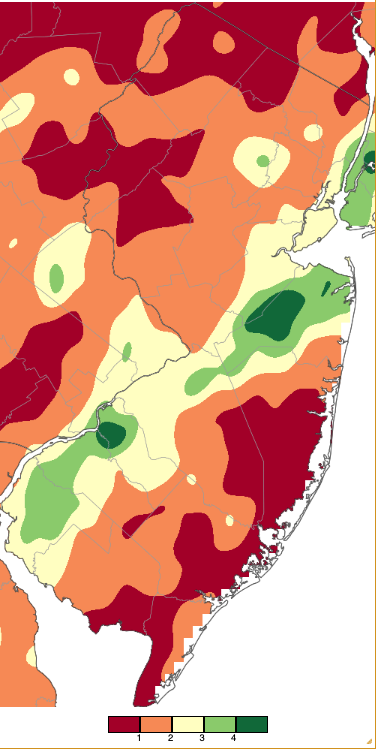
Figure 2. Precipitation across New Jersey from 8 AM on September 9th through 8 AM September 12th based on a PRISM (Oregon State University) analysis generated using NWS Cooperative, CoCoRaHS, NJWxNet, and other professional weather station observations.
The last warmer rain episode occurred in the far south early on the 13th, lingering into late morning. Middle Township (Cape May) and Dennis (Cape May) each caught 2.06”, Woodbine (Cape May) 2.12” and 1.98” (two stations), and Estell Manor (Atlantic) and Maurice River Township (Cumberland) each 1.98”. Just 26 CoCoRaHS stations exceeded 1.00”. Wind gusts reached 44 mph at Lower Alloways Creek Township and 43 mph at Atlantic City Marina (Atlantic).
The 15th was dry across NJ while Hurricane Lee traveled up the coast to the east. The storm was large enough for the western edge of its cloud deck to reach the northeast corner of the state early in the day (Figure 3), later spreading to a good portion of northern and central NJ. The rising motion of air within the storm complex resulted in subsiding air at its periphery, leading to a very dry deep blue sky (Figures 4 and 5).
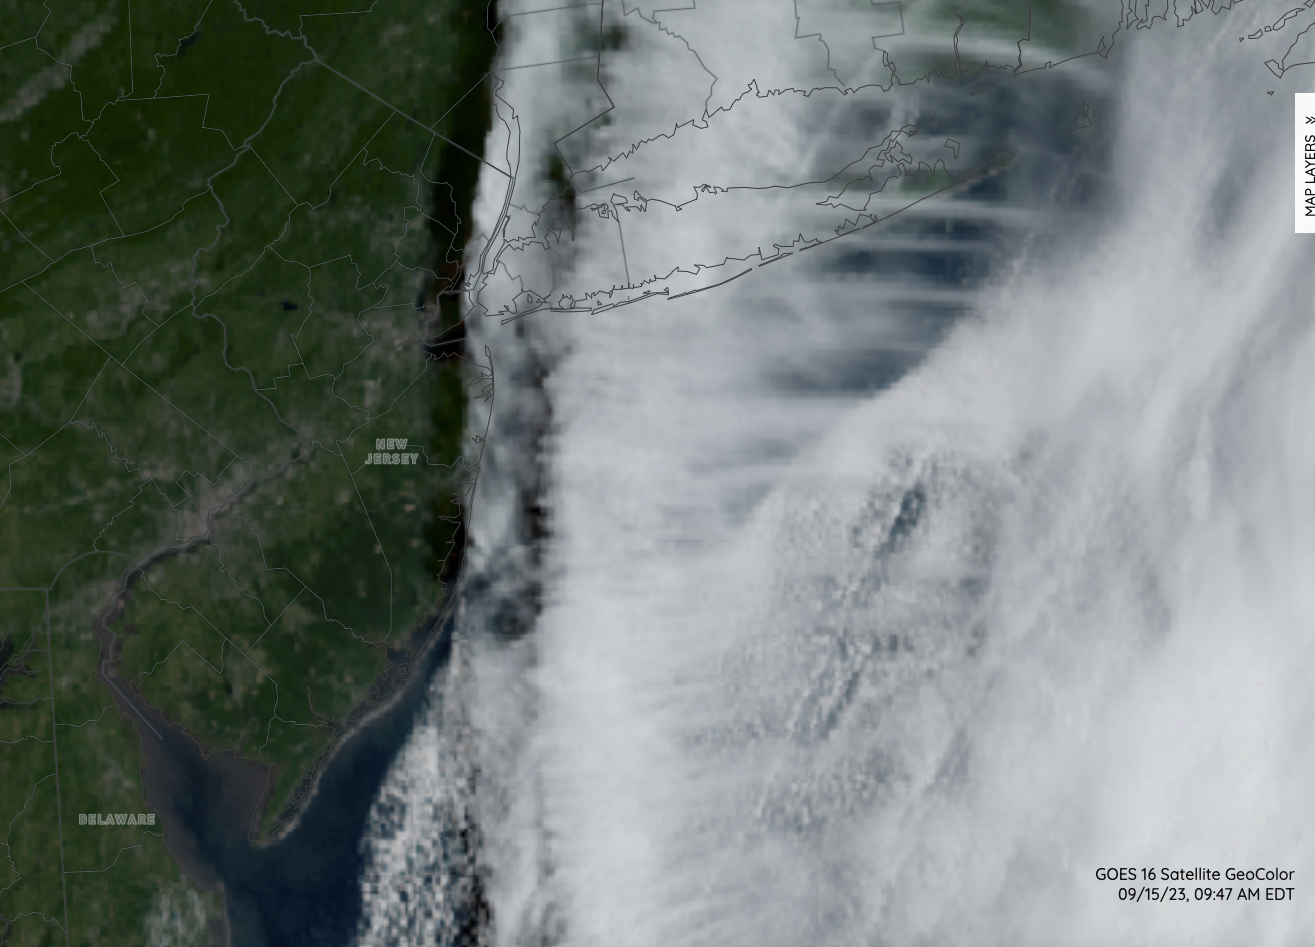
Figure 3. NOAA GOES visible image at 9:47 AM EDT on September 15 showing the western periphery of Hurricane Lee and the shadow being cast just to the west of the cloud line over eastern NJ.
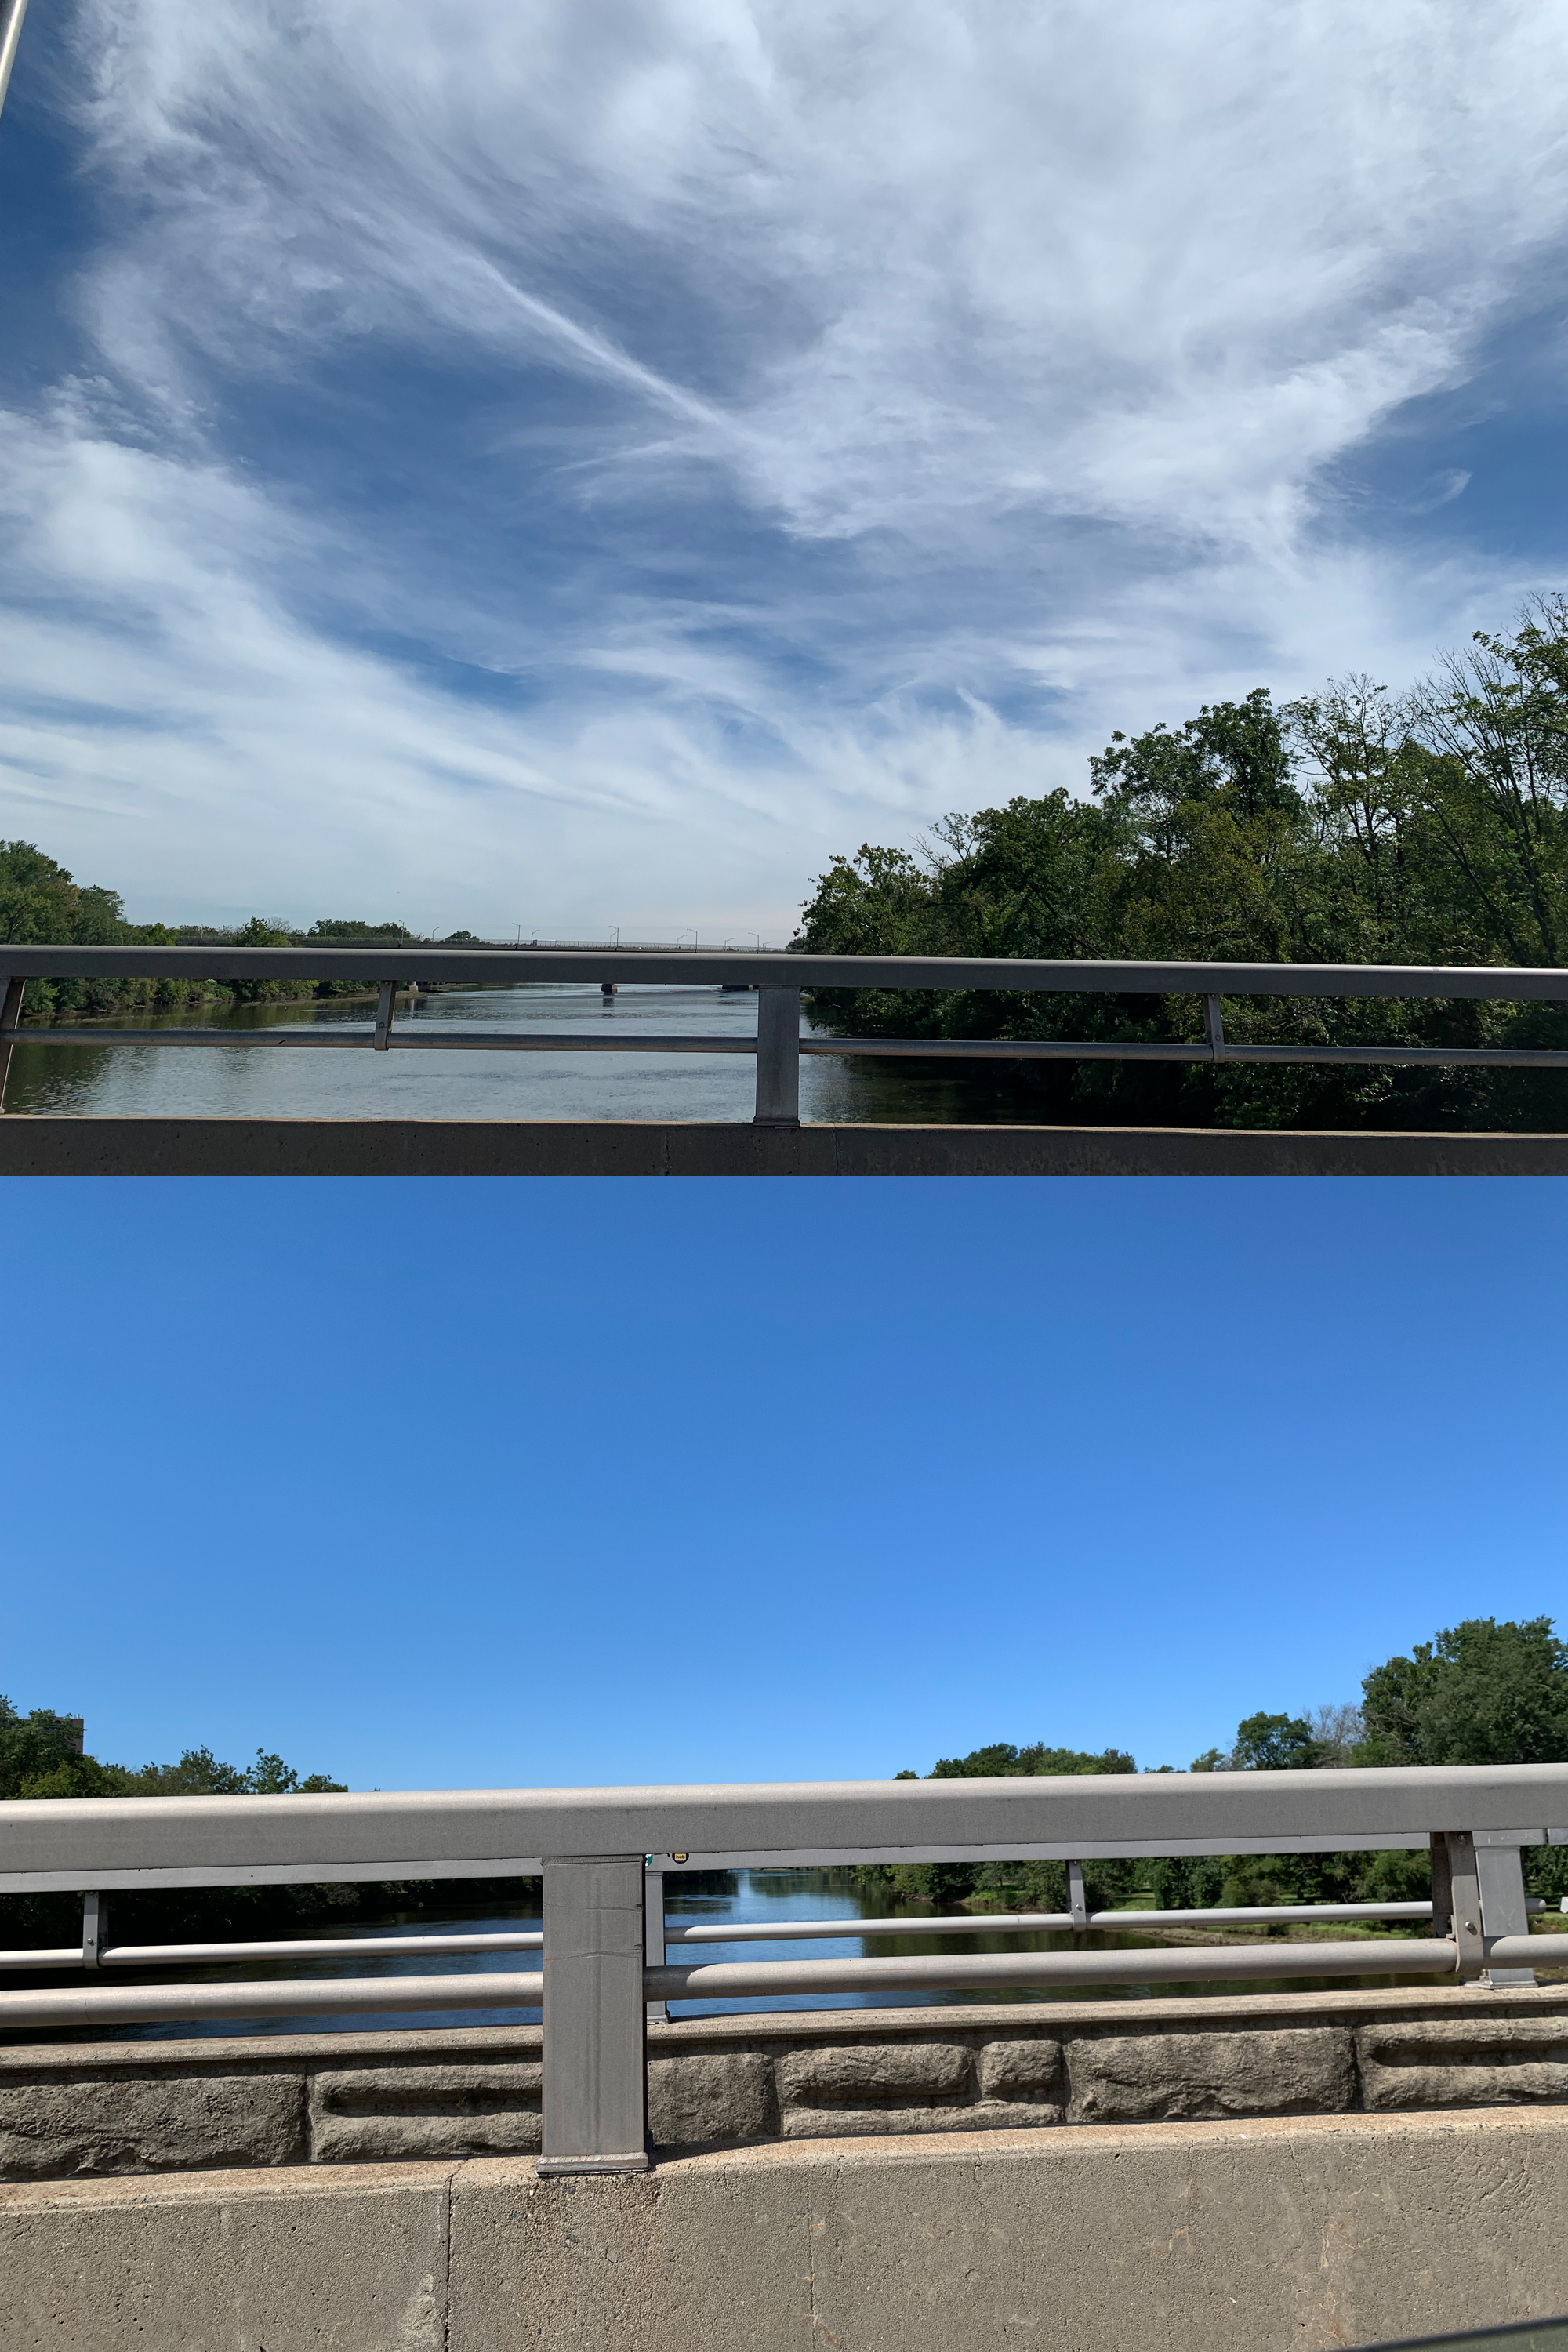
Figure 4. Top: Cirrus cloud cover from the western periphery of Hurricane Lee looking east from Landing Lane Bridge between Piscataway (Middlesex) and New Brunswick (Middlesex) at 12:30 PM EDT on September 15th. Bottom: Deep blue sky looking west from the bridge at the same time (photos by D. Robinson).
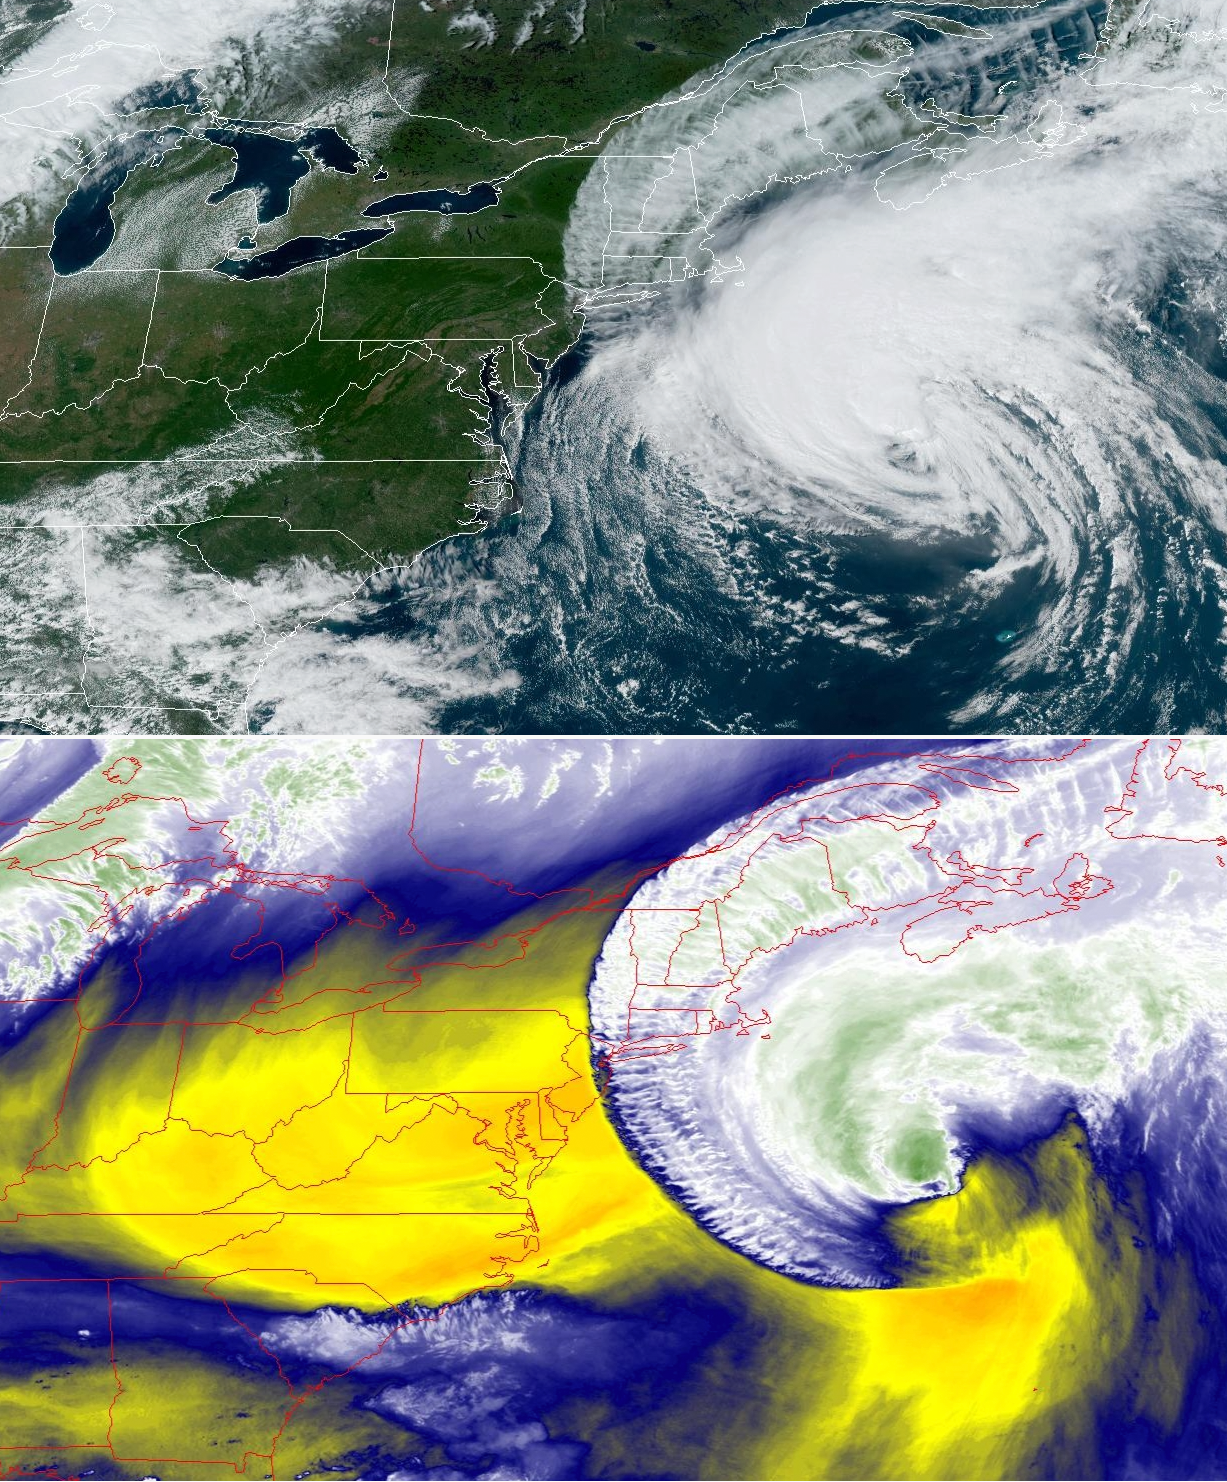
Figure 5. Top: NOAA GOES visible image showing Hurricane Lee off the East Coast at 2:31 PM EDT on September 15th. Bottom: NOAA GOES water vapor image at 2:31 PM EDT with the driest air as yellow/orange shades and wettest as green. Notice the dry air getting entrained into Lee, contributing to a weakening of the storm.
An extended 12-hour period of rain provided a hint of forthcoming cooler conditions late on the 17th extending into the afternoon of the 18th. A wide area received 1.00”–1.99”, including 156 of the 269 CoCoRaHS reports (Figure 6). Top totals included 2.48” in Kearny (Hudson), Ringwood (Passaic) 2.28”, Vernon Township (Sussex) 2.10”, and North Arlington (Bergen) and Bedminster (Somerset) each 2.06”. Late in the event, a beautiful rainbow scene was captured by photographer Stan Brajer (Figure 7).
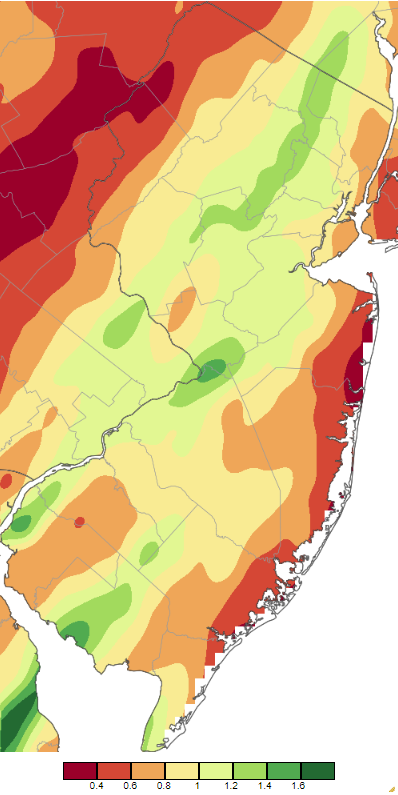
Figure 6. Precipitation across New Jersey from 8 AM on September 17th through 8 AM September 19th based on a PRISM (Oregon State University) analysis generated using NWS Cooperative, CoCoRaHS, NJWxNet, and other professional weather station observations.

Figure 7. Rainbow scene in Roxbury (Morris) early in the evening on September 18th (photo by S. Brajer).
Following four days of delightful weather, rain moved into NJ from the south late on the 22nd into the morning of the 23rd, becoming heavy along the central coast into the afternoon, and ending as light rain early on the 24th. This rain, along with tropical storm force wind gusts and minor to moderate coastal flooding, was courtesy of the remnants of Tropical Storm Ophelia that had previously made landfall in North Carolina after developing off the Southeastern coast. Rainfall totaled 5.23” in Toms River (Ocean), Stafford Township (Ocean) 5.05” and 4.55” (two stations), and Egg Harbor City (Atlantic) 4.70” and 4.49” (two stations). Thirty-six CoCoRaHS station caught 3.00”–5.23”, 38 from 2.00”–2.99”, and 144 from 1.00”–1.99” (Figure 8). Mount Olive (Morris) saw the least, with 0.32”. Winds late on the 22nd gusted to 41 mph at Atlantic City Marina and 40 mph in Little Egg Harbor Township (Ocean). On the 23rd, Rutgers NJ Weather Network stations recorded gusts up to 56 mph in Seaside Heights (Ocean), Harvey Cedars (Ocean) 54 mph, both Atlantic City Marina and Little Egg Harbor Township 50 mph, and 41–49 mph at five sites. Reports of gusts near 60 mph were posted from other coastal stations. The worst coastal flooding occurred at morning high tide on the 23rd.
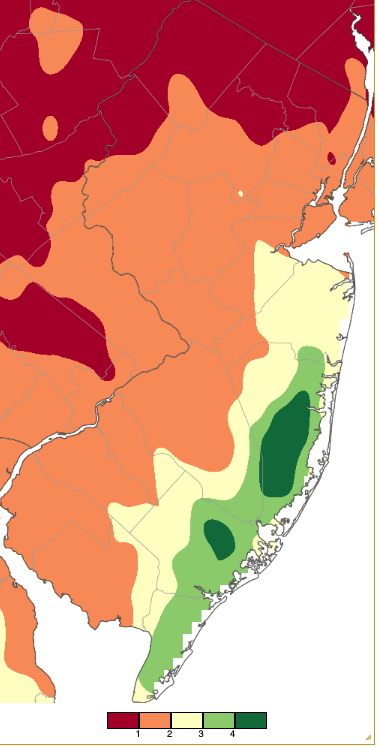
Figure 8. Precipitation across New Jersey from 8 AM on September 22nd through 8 AM September 24th based on a PRISM (Oregon State University) analysis generated using NWS Cooperative, CoCoRaHS, NJWxNet, and other professional weather station observations.
Rain resumed in central and northern areas on the 24th, lasting until the pre-dawn hours of the 25th. Totals included Montague (Sussex) 2.46”, Warren (Somerset) 2.33”, and Metuchen (Middlesex) 1.22”. Persistent coastal rain and widespread drizzle continued on the 25th and 26th, bringing 25th rains of 1.37” to Pine Beach (Ocean), Brick (Ocean) 1.30” and 1.28” (two stations), and Manasquan 1.22”. Gusts remained strong on the 24th to 26th, as the remnants of Ophelia parked itself off the Mid-Atlantic coast. Seaside Heights reached 51 mph, Sea Girt (Monmouth)48 mph, and Harvey Cedars 44 mph on the 24th, Seaside Heights 47 mph, Sea Girt 45 mph, Harvey Cedars 42 mph, and Atlantic City Marina 40 mph on the 25th, and Harvey Cedars 42 mph and Little Egg Harbor Township 41 mph on the 26th. Tidal flooding continued during this period, with the offshore storm and a full moon contributing to flooding into the first few days of October.
The final chapter of the wet month continued to be associated with the still-present remnants of Ophelia as it joined forces with a front moving in from the west to focus some exceedingly heavy rain in extreme eastern Monmouth County northward into New York City late on the 28th and especially on the 29th. Heavy rain also fell a bit further to the west. Monmouth County totals included a remarkable 10.40” at Bradley Beach, followed by 9.00” and 7.95” at two Neptune Township stations, Long Branch 7.90”, Ocean Township 7.88”, Oceanport 7.04”, Wall Township 6.43” and 4.80” (two stations), Sea Girt 5.68”, Eatontown 5.52”, Manasquan 5.12”, and Little Silver 4.51” (Figure 9). Nine stations reported 3.00”–3.99”, 36 from 2.00”–2.99”, and 107 from 1.00”–1.97”. Lower Township (Cape May) received just 0.12”.
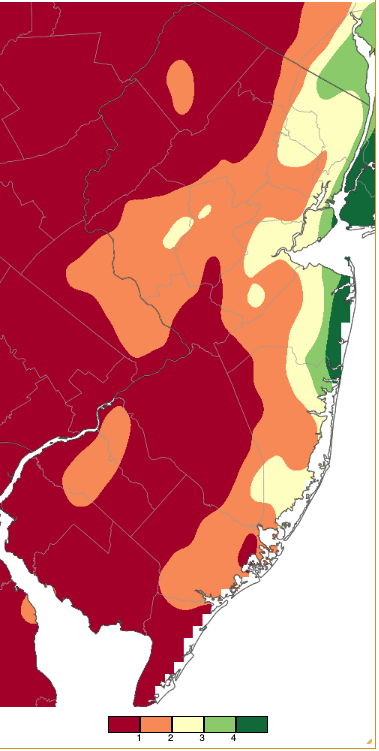
Figure 9. Precipitation across New Jersey from 8 AM on September 28th through 8 AM September 30th based on a PRISM (Oregon State University) analysis generated using NWS Cooperative, CoCoRaHS, NJWxNet, and other professional weather station observations.
The highest barometric pressure of the month occurred on both the 22nd and 27th when values were between 30.30”–30.45”. The 7th and 18th saw the lowest pressures, each between 29.70”–29.80”.
Temperature
Just like this past August, September began with several cool mornings with some Jersey locations in the 40°s. This included lows on the 1st of 42° at Walpack (Sussex), Sandyston (Sussex) 42°, and Pequest (Warren) 45°. In the Pinelands, Berkeley Township (Ocean) fell to 44° on the 2nd. This was it for the cool weather for two weeks, as summer warmth invaded.
High temperatures exceeded 90° at multiple Rutgers NJ Weather Network stations from the 3rd to 9th. This was the longest continuous period of such warmth in 2023. On the 3rd, Lower Alloways Creek Township, Pennsauken (Camden), Red Lion (Burlington), Sicklerville (Camden), and South Harrison (Gloucester) made it to 93°. Lower Alloways Creek Township hit, to this point, a statewide season-tying high of 97° on the 4th, followed by 19 stations at 95° or 96° and 29 from 90°–94°. High Point Monument (Sussex) was least warm at 82°. Berkeley Township went from coldest on the 2nd to hottest on the 5th, reaching 95°. Forty-eight stations followed from 90°–94°. Elevated High Point Monument and coastal Harvey Cedars each only made it to 83°. Egg Harbor Township (Atlantic), Hammonton, Lower Alloways Creek Township, and Red Lion reached 97° on the 6th, with 18 stations either 95° or 96° and 35 from 90°–94°.
September 7th was the hottest day of 2023. Fort Dix (Burlington) made it to 100°, while 31 NJWxNet stations rose to 95°–98° and 25 from 90°–94° (Figure 10). Harvey Cedars reached 83°. The heat continued on the 8th with Pennsauken, Piney Hollow (Gloucester), and Sicklerville at 97°, and 36 stations from 90°–96°. The last 90° day of the year likely occurred on the 9th with Piney Hollow and Upper Deerfield (Cumberland) each at 92° and 7 others 90°–91°.
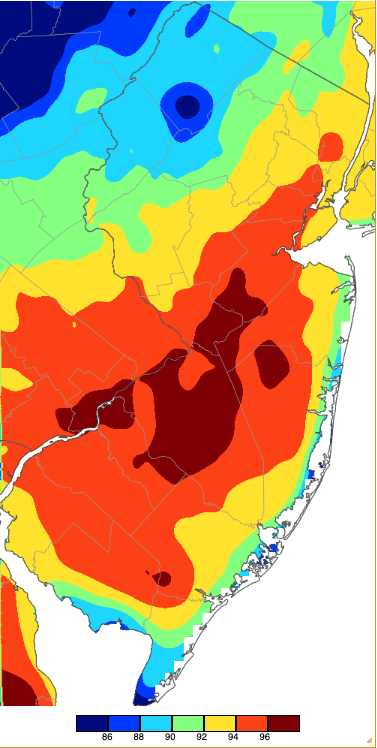
Figure 10. Maximum temperatures on September 7th based on a PRISM (Oregon State University) analysis generated using NWS, NJWxNet, and other professional weather stations. Note the 2° scale beneath the map.
Enough cool weather and clear skies returned to NJ by the 15th to again see some NJWxNet stations fall to lows of 40°–45°. Walpack reached 40° on that day, with Sandyston at 42°, High Point Monument 43°, and Pequest 45°. Four coastal stations only made it down to 60°. Walpack was 43° on the 16th with both Hopewell Township (Mercer) and Sandyston 45°. Statewide, the 17th was the coolest morning of the month (Figure 11). Sandyston fell to 41°, Walpack 43°, and ten stations either 44° or 45°.
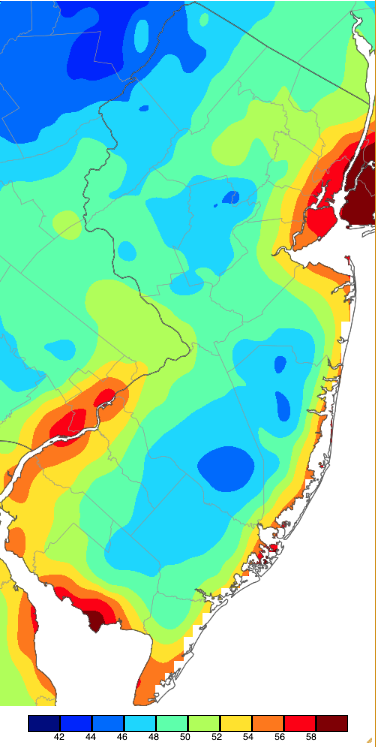
Figure 11. Minimum temperatures on September 17th based on a PRISM (Oregon State University) analysis generated using NWS, NJWxNet, and other professional weather stations. Note the 2° scale beneath the map.
The 19th found Walpack down to 45°. Oswego Lake (Burlington) and Sandyston were 43° on the 20th, with five locations 44°–45°. Sandyston was again coolest on the 21st at 41° with nine sites 43°–45°. Walpack returned to being the cold spot on the 22nd at 42°. The 27th proved to be the coldest morning of the month in north Jersey, however, this was not shared with the south (Figure 12). Sandyston fell to 40° and eleven stations were from 42°–45°. Atlantic City Marina was least cold at 61°. Walpack was coolest on the 28th at 41° with eight locations from 43°–45°.
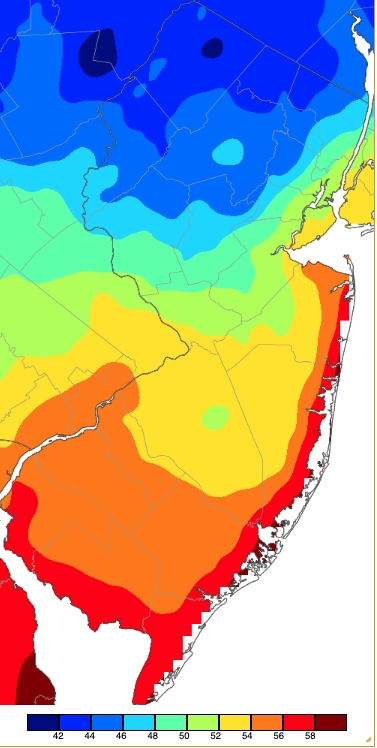
Figure 12. Minimum temperatures on September 27th based on a PRISM (Oregon State University) analysis generated using NWS, NJWxNet, and other professional weather stations. Note the 2° scale beneath the map.


