Overview
Post-tropical storm Ida. The title of this month’s report speaks to this momentous weather extreme that will forever be the defining event of this month and likely the entire year. The storm delivered the most powerful tornado to strike the Garden State since 1990, demolishing multiple homes in Gloucester County. Rainfall exceeding 3.00” per hour led to the most widespread flash flood event on record for the state, resulting in the tragic deaths of 30 individuals in central and northeastern locales. A separate report on Ida has been prepared and may be accessed here.
There were 29 other days of weather this month that fortunately were not as dramatic as Ida on the 1st. All told, monthly precipitation averaged 6.20” across NJ. This was 2.04” above the 1991–2020 normal and ranks as the 15th wettest September since 1895. The north, where the bulk of Ida’s rain fell, averaged 8.92”, which was 4.46” above normal and ranks 7th wettest. The south averaged 4.61”, which was 0.62” above normal and ties as the 31st wettest. Along the coast, only 3.81” fell, some 0.08” below normal and ranking 44th wettest.
As attention was paid to Ida recovery efforts and simply because of warm temperature conditions in many early falls this century, most might not have a sense that the average statewide September temperature of 68.8° was 1.9° above normal and ranked as the 11th warmest of the past 127 years (Table 1). Nine of the 15 warmest Septembers since 1895 have occurred in the past 17 years. To exemplify how unusual this is, should 17-year intervals back to 1895 all have had thermal variability similar to one another, each would average two years in the top 15. The statewide average high temperature in September was 78.4°, which was 1.2° above normal and the 21st warmest. The average low of 59.0° was 2.4° above normal and ranked 7th mildest.
| Rank | Year | Sept. Avg. Temp |
|---|---|---|
| 1 | 1961 | 70.8° |
| 2 | 2015 | 70.7° |
| 3 | 2018 | 70.2° |
| 3 | 2005 | 70.2° |
| 5 | 2016 | 69.7° |
| 6 | 1931 | 69.6° |
| 7 | 2010 | 69.2° |
| 8 | 1921 | 69.1° |
| 9 | 2019 | 69.0° |
| 10 | 2011 | 68.9° |
| 11 | 2021 | 68.8° |
| 12 | 1930 | 68.6° |
| 13 | 2017 | 68.2° |
| 13 | 1998 | 68.2° |
| 13 | 1980 | 68.2° |
Table 1. The 15 warmest Septembers across New Jersey since 1895.
Precipitation and Storms
Certainly, Ida’s rain had a lot to say about the distribution of September precipitation across New Jersey (Figure 1). The northern half of the state was well above normal, and the southern half was drier the further south one headed until below-average monthly totals were seen in the southernmost counties. Excluding the rain on the 1st into the predawn hours of the 2nd, precipitation over the remainder of the month totaled 2.00”–3.00” across much of the state, with the northwest coming in with 4.00”–6.00”, except as much as 6.00”–8.00” in a good portion of Warren County (Figure 2).
Among Rutgers NJ Weather Network (NJWxNet) stations and Community Collaborative Rain, Hail, and Snow Network (CoCoRaHS) stations, top monthly precipitation honors went to Pequest (Warren County) with 13.08”, followed by Hopewell Township (Mercer) 12.25”, three Hillsborough Township (Somerset) stations with 11.98”, 11.94”, and 11.77”, Bridgewater (Somerset) 11.83”, North Arlington (Bergen) 11.79”, Knowlton Township (Warren) 11.77”, Manville (Somerset) 11.59”, and Sandyston (Sussex) 11.44”. The driest locations included Lower Township (Cape May) with 2.28”, Sea Isle City (Cape May) 2.47”, two stations in Egg Harbor City (Atlantic) 2.54” and 2.65”, Long Beach Township (Ocean) 2.88”, and Ocean City (Cape May) 2.98”.
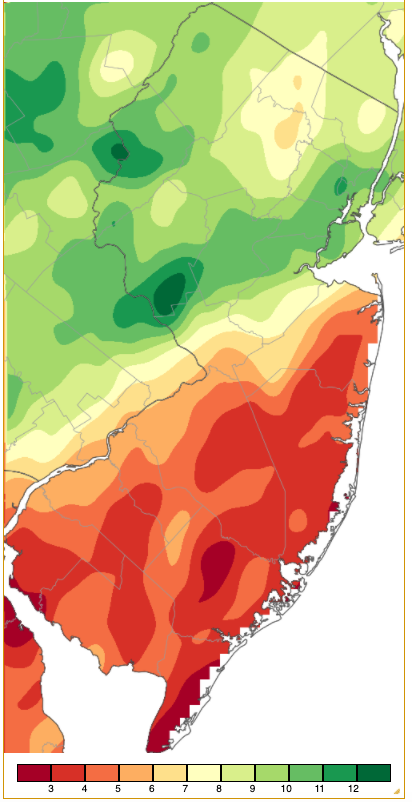
Figure 1. September 2021 precipitation across New Jersey based on a PRISM (Oregon State University) analysis generated using NWS Cooperative and CoCoRaHS observations from 7 AM on August 31st to 7 AM on September 30th. Note the scale in inches at the bottom of the map. Totals range from 2.00”–3.00” (dark red) to 12.00”–13.00” (dark green).
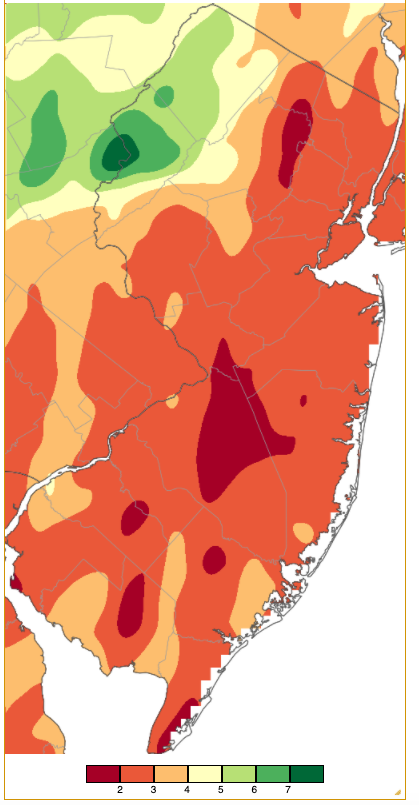
Figure 2. Precipitation across New Jersey from 7 AM on September 2nd through 7 AM on September 30th based on a PRISM (Oregon State University) analysis generated using NWS Cooperative and CoCoRaHS observations from 7 AM on August 31st to 7 AM on September 30th. This reflects precipitation for the remainder of the month following Ida on the 1st. Note the scale in inches at the bottom of the map. Totals range from 1.00”–2.00” (red) to 7.00”– 8.00” (dark green).
Again, please view the special Ida report to learn more about the storm that occurred from the afternoon of the 1st into the early hours of the 2nd. Below, a map of storm rainfall and a table showing maximum rainfall within each county are presented, showing totals as high as 9.45” in Hillsborough, 9.20” in Flemington (Hunterdon), and 9.02” in North Arlington. Outside of the three tornadoes associated with the storm (making 13 NJ twisters thus far this year), straight-line winds gusted to 53 mph at Hillsborough, 47 mph in Fortescue (Cumberland), 46 mph at Harvey Cedars (Ocean), 45 mph in Berkeley Township (Ocean), and 40–44 mph at nine other NJWxNet stations. There were no reports of damage or power outages associated with these winds.
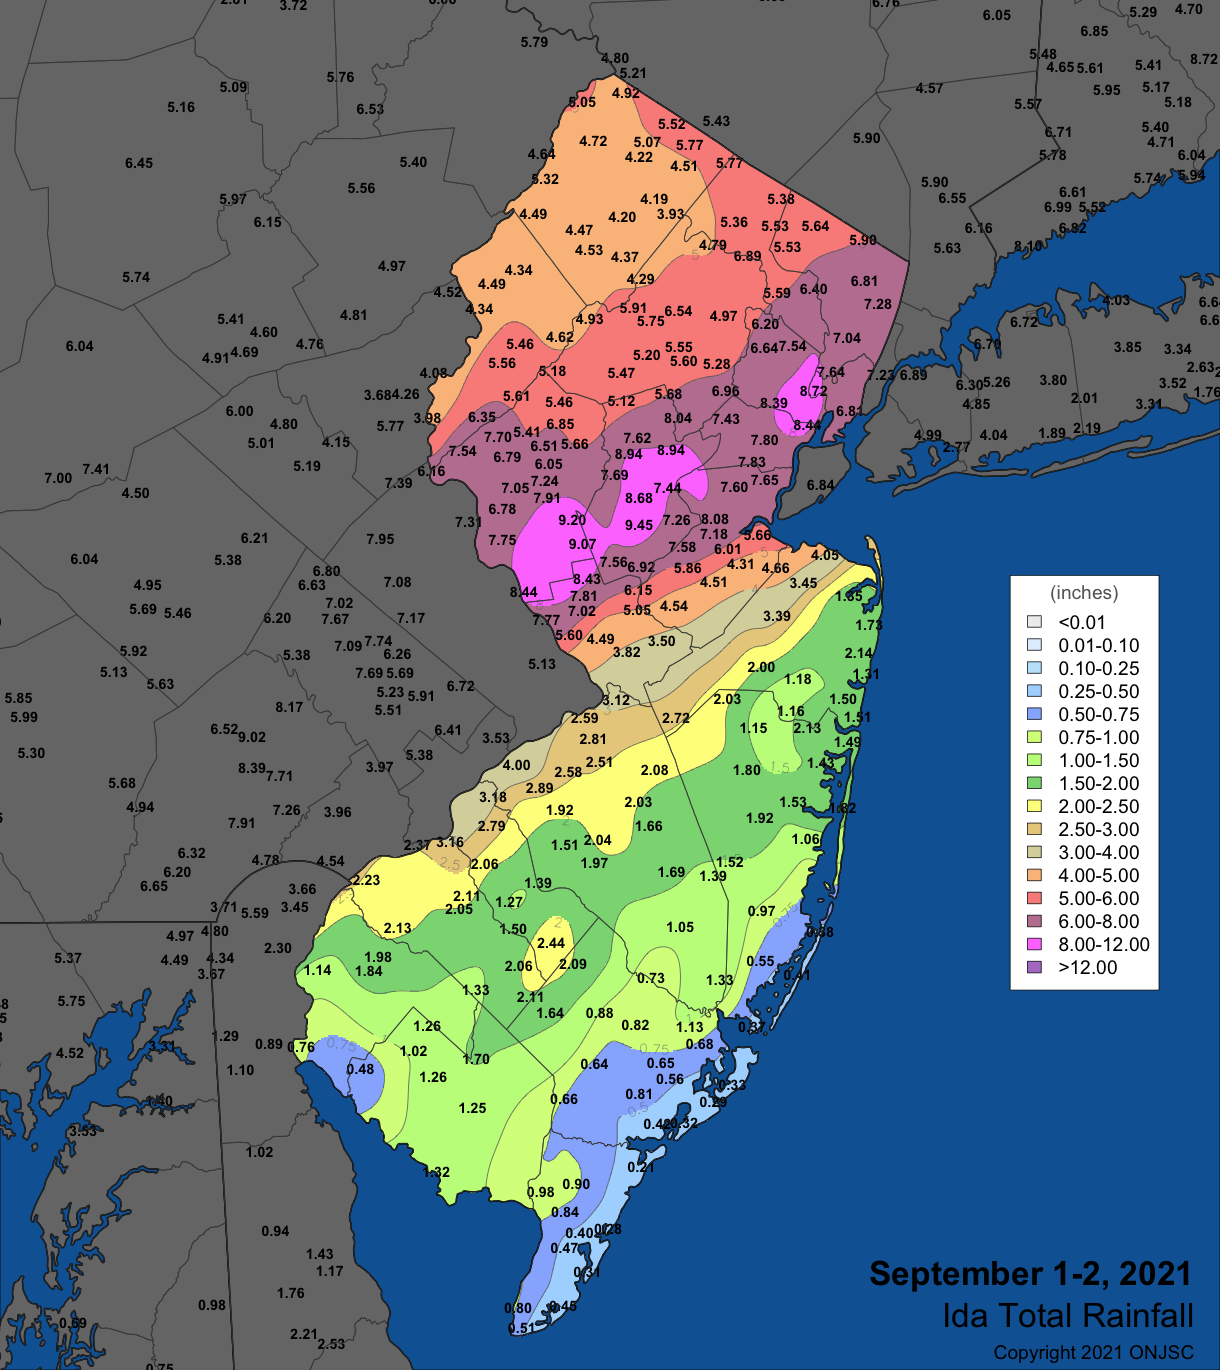
Figure 3. September 1st–2nd rainfall in NJ and surrounding states based on observations from Rutgers NJ Weather Network, NJ CoCoRaHS, National Weather Service Cooperative stations, and observations from several other networks. Around 370 NJ observations were used to generate the map. Not all observations that went into the colored contouring in NJ are shown to avoid overlapping values.
| County | Location | Rainfall |
|---|---|---|
| Atlantic | Hammonton | 2.22” |
| Bergen | North Arlington | 9.02” |
| Burlington | Riverside Township | 4.00” |
| Camden | Pennsauken | 3.49” |
| Cape May | Dennis Township | 0.98” |
| Cumberland | Deerfield Township | 1.71” |
| Essex | Maplewood | 8.39” |
| Gloucester | West Deptford | 3.16” |
| Hudson | Harrison | 8.72” |
| Hunterdon | Flemington | 9.20” |
| Mercer | Hopewell Township | 9.13” |
| Middlesex | New Brunswick | 8.44” |
| Monmouth | Middletown | 4.05” |
| Morris | Long Hill Township | 7.65” |
| Ocean | Toms River | 2.66” |
| Passaic | Little Falls | 7.14” |
| Salem | Woodstown | 1.98” |
| Somerset | Hillsborough | 9.45” |
| Sussex | Vernon Township | 5.77” |
| Union | Newark Airport | 8.44” |
| Warren | Greenwich Township | 6.63” |
Table 2. The heaviest rainfall observed from on September 1st–2nd in all NJ counties based on observations from Rutgers NJ Weather Network, NJ CoCoRaHS, National Weather Service Cooperative stations, and observations from several other networks. A full listing of rainfall totals can be viewed here.
The next storm, thankfully, saw the heaviest rain confined to southern areas that had emerged unscathed from Ida. The second half of the 5th until early on the 6th brought 1.53” to Maurice River (Cumberland), 1.49”, 1.47”, and 1.36” to three Woodbine (Cape May) locations, and 1.22” to Dennis Township (Cape May). Only the far south received over 0.50”. Next up was heavy rain entering the northwest on the evening of the 8th into the morning of the 9th. Southern areas joined in later in the period, with scattered showers continuing on the afternoon of the 9th. Fortunately, central, and northeast areas, hit worse by Ida, again escaped the heaviest of the rain (Figure 4). Knowlton Township received 3.98”, two Blairstown (Warren) locations caught 3.09” and 2.94”, with Liberty Township (Warren) 2.85”, Frelinghuysen Township (Warren) 2.72”, Stillwater (Sussex) 2.27”, Egg Harbor Township (Atlantic) 2.14”, and 50 other CoCoRaHS station from 1.00”–2.13”.
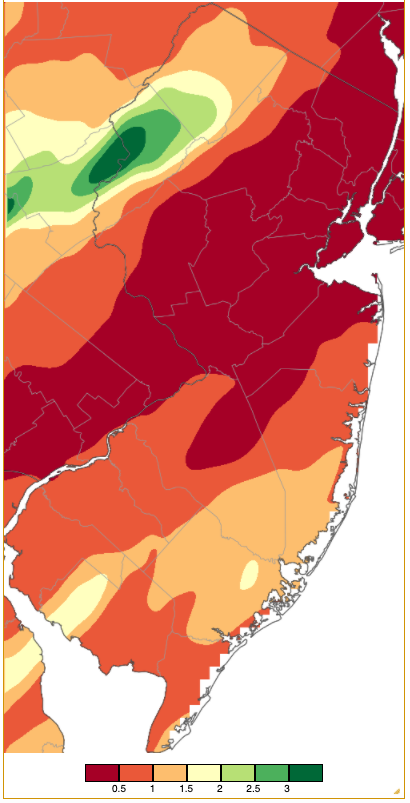
Figure 4. Rainfall from approximately 7 AM on September 8th to 7 AM on September 10th based on a PRISM (Oregon State University) analysis generated using NWS Cooperative and CoCoRaHS observations. Note the scale in inches at the bottom of the map.
A lightning-filled squall line blew through a zone from Warren County southeast into Monmouth County on the evening of the 13th, depositing rains of at least 0.50”. Peak rainfall amounted to 1.99” in Hackettstown (Warren), Belvidere (Warren) 1.66”, Liberty Township (Warren) 1.63”, Mt. Olive (Morris) 1.42”, Roxbury Township (Morris) 1.33”, and 46 locations picked up from 0.50”–1.30”. Winds gusted to 47 mph at Oceanport (Monmouth) and 41 mph in Sea Girt (Monmouth). Thunderstorms during the evening of the 15th in early on the 16th brought the northwest rain amounting to as much as 0.91” in Stillwater and 0.82” at Wantage (Sussex). Southern showers during the afternoon of the 16th into early on the 17th amounted to as much as 0.71” in Galloway Township (Atlantic) and 0.69” in Port Republic (Atlantic).
A front moved from west to east through the state during the early to mid-evening of the 23rd. Thunderstorms produced wind gusts to 56 mph at Lower Alloways Creek Township (Salem), 45 mph in Fortescue, 42 mph at Upper Deerfield (Cumberland), and 41 mph at South Harrison (Gloucester). Rainfall totaled as much as 3.00” in Roxbury Township, Newton (Sussex) 2.75”, Chester (Morris) 2.72”, Oxford Township (Warren) 2.56”, Mine Hill Township (Morris) 2.52”, Greenwich Township (Warren) 2.49”, and Holland Township (Hunterdon) 2.46” (Figure 5). Of 270 CoCoRaHS reports, 60 were between 2.00”–3.00” and 164 from 1.00”–1.99”.
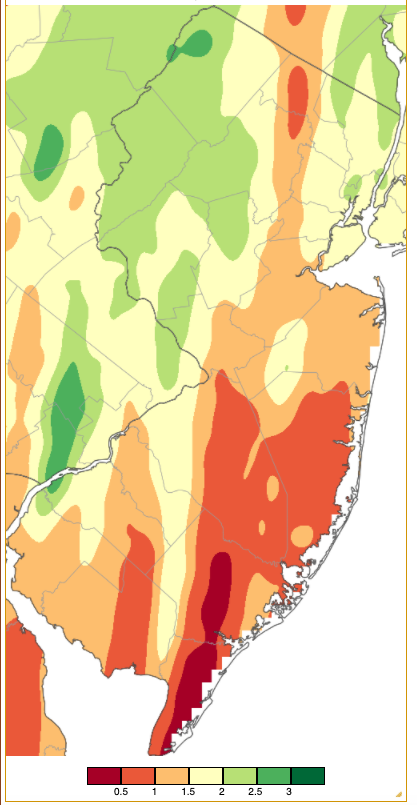
Figure 5. Rainfall from approximately 7 AM on September 23rd to 7 AM on September 24th based on a PRISM (Oregon State University) analysis generated using NWS Cooperative and CoCoRaHS observations. Note the scale in inches at the bottom of the map.
The last rain event of the month saw thunderstorms in the north in the morning and in the south during the evening of the 28th. The most rain fell in the northwest, with Hardyston (Sussex) at 0.99”, Vernon Township (Sussex) 0.81”, and West Milford (Passaic) 0.73”. Winds gusted to 40 mph at High Point Monument (Sussex).
The remnants of Ida brought the lowest pressure of the month to NJ with values near 29.45” in central areas and as high as 29.65” in the northwest. The 20th and 21st had peak monthly pressures of 30.30”–30.40”. Aside from previously-mentioned 40 mph or greater wind gusts, the tail end of Ida brought gusts to 40 mph at Lower Alloways Creek Township and Harvey Cedars on the 2nd. High Point Monument reached 41 mph on the 10th.
Temperature
There were 11 September days when high temperatures at multiple NJWxNet stations reached or exceeded 85°. Most occurred in the second and third weeks of the month. However, before Ida arrived on the 1st and helping to fuel some of the severe activity, Lower Alloways Creek Township made it to 87° and ten locations were either 85° or 86°. Red Lion (Burlington) hit 86° on the 6th, with 8 sites at 85°. Four locations made it to 85° on the 7th, and Moorestown (Burlington) stood out at 90° on the 8th when 33 stations came in from 85°–87°.
Six of the seven days from the 12th–18th had maximums of 85° or higher. Eight reached 86° and seven 85° on the 12th, while seven hit 89° and 42 from 85°–88° on the 13th. Pennsauken saw 88° on the 14th, with 20 stations from 85°–87°. The 15th was the warmest day of the month with Moorestown and Pennsauken (Camden) topping out at 91°, four locations at 90°, and 42 from 85°–89°. The Inner Coastal Plain saw the greatest warmth, with cooler conditions along the coast and in the Highlands (Figure 6). Harvey Cedars was coolest at 77°, with West Cape May (Cape May) and High Point Monument, each at 79°, the only other sub-80° sites in NJ. Fortescue hit 86° and Mannington (Salem) 85° on the 16th. West Deptford (Gloucester) made it to 89° and 39 stations came in from 85°–88° on the 18th. A few days later on the 22nd, three locations reached 85° to close out the month for warmth at and above that level.
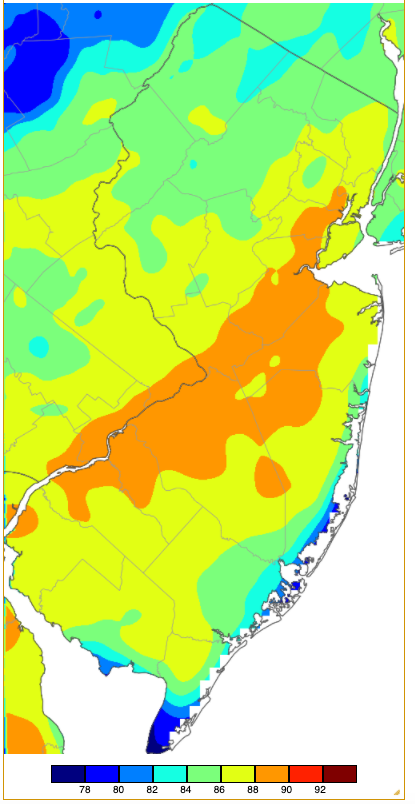
Figure 6. Maximum temperatures on September 15th based on a PRISM (Oregon State University) analysis generated using NWS, NJWxNet, and other professional weather stations. Note the in 2 °F increments at the bottom of the map.
Seventeen September days saw low temperatures fall between 38° to 49°. As is often the case, the coldest locations were in the northwest. This started off, not surprisingly, with the valley location of Walpack (Sussex) dipping to 48° on the 2nd. Walpack was 46° with six locations 47°–49° on the 3rd, and Walpack and Sandyston fell to 48° on the 4th. Sandyston was 47° on the 7th. Sandyston and Walpack each fell to 46° on the 10th, Sandyston 43°, Pequest and Walpack 45°, with 18 sites from 46°–49°on the 11th, and Walpack 48° on the 12th.
Walpack dropped to 47° on the 19th. Walpack, Pequest, and Sandyston joined in at 46° on the 20th, with six locations from 47°–49°. Basking Ridge (Somerset) was lowest at 48° on the 21st when five stations were 49°.
The last week of the month found lows under 50° each day. Walpack and High Point Monument were 47° and seven sites either 48° or 49° on the 24th. Sandyston at 43° and Pequest 44° were the only sites in the 40°s on the 25th. Walpack led with 45° and seven other stations got to 46°–49° on the 26th. Sandyston and Walpack had lows of 45° and 16 stations from 46°–49° on the 27th. Walpack and High Point Monument snuck down to 49° on the 28th.
The coldest morning of the month was the 29th, when Walpack reached 38°, 42° was the low at Pequest, Sandyston, and High Point Monument, and 15 NJWxNet stations were 43°–49°. Figure 7 shows the cooler conditions covering much of the northern half of the state and southward into the northern Pinelands. Meanwhile, the urban areas of the northeast, locations down the Atlantic Coast, and up Delaware Bay and the Delaware River to about Camden were mildest, sitting in the mid to upper 50°s. High Point Monument fell to 44° on the 30th when 18 locations had lows ranging from 46°–49°.
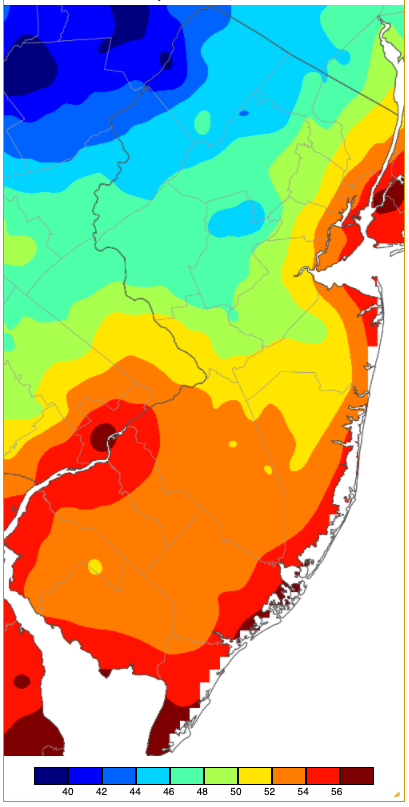
Figure 7. Minimum temperatures on September 29th based on a PRISM (Oregon State University) analysis generated using NWS, NJWxNet, and other professional weather stations. Note the in 2 °F increments at the bottom of the map.


