Overview
As reported multiple times during the first half of 2022, the day-to-day weather and overall climate of the Garden State have varied frequently, exhibiting lots of variability and never “locking” into a given pattern for an extended period of several weeks or longer. Such was the case this June, making it difficult to define any conditions that dominated. June was somewhat drier than average, but eight events brought over an inch of rain somewhere within the state. It was also dry enough at one point for a wildfire to scorch over 13,000 acres of the Pine Barrens. Low temperatures fell into the upper 30°s and low 40°s at multiple locations on the 20th, yet three days earlier, the majority of the state saw highs in the low to middle 90°s. “Non-descript” seems the best way to sum things up.
Statewide, rainfall averaged 3.44”. This is 0.86” below the 1991–2020 normal and ranks as the 61st driest of the 128 Junes since 1895 (Figure 1). The north received 3.59” (-1.02”, 61st driest), the south 3.39” (-0.75”, 61st driest), and coast 2.90” (-0.95”, 54th driest). As the map shows, the far south was driest, continuing a pattern seen in recent months. The June 30th U.S. Drought Monitor map has the bulk of the southern area seen on the Figure 1 map receiving less than 4.00” for the month classified as “Abnormally Dry” (D0). This rating is also a function of both low streamflow and ground water levels. Further north, pockets of above-average rainfall surrounded a below-average central region that has yet to have prolonged enough water deficits to qualify for D0 status.

Figure 1. June 2022 precipitation across New Jersey based on a PRISM (Oregon State University) analysis generated using NWS Cooperative and CoCoRaHS observations from 8 AM on May 31st to 8 AM on June 30th. Note the scale in full inches at the bottom of the map. Totals range from 0.00–1.00” (dark red) to 8.00”–9.00” (dark green).
The statewide average temperature of 69.8° for June was 0.5° below normal. This ties as the 46th warmest June since 1895, at first glance an odd ranking. However, because decades earlier than the 1991–2020 normal period were cooler, this past month’s normal was 0.9° above the 1895–2022 average. The average daily maximum was 80.7° (-0.3°, tied for 52nd warmest) and the daily minimum 58.9° (-0.7°, tied for 43rd warmest). The north averaged 67.6° (-1.0°, 65th warmest), south 71.2° (-0.2°, tied for 35th warmest), and coast 70.3° (-0.2°, tied for 32nd warmest).
Precipitation and Storms
The wettest locations in June received several more inches than normal. As Figure 1 displays, these areas were not all that widespread. Among NJ CoCoRaHS and Rutgers NJ Weather Network stations, a location in Mount Olive Township (Morris County) was wettest at 7.69”. Another station in that community caught 6.78”. Other monthly totals exceeding 6.00” included Columbus (Burlington) with 6.77”, Haddon Heights (Camden) 6.30”, Cherry Hill (Camden) 6.26”, Moorestown (Burlington) 6.13”, and Mt. Ephraim (Camden) 6.08”. On the low end were multiple locations in Cumberland County coming in at more than 2.00” below normal, including Fortescue with just 0.72”, Vineland 1.17” and 1.65” at two locations, Deerfield Township 1.47”, and Maurice River Township 1.62”. Buena Vista (Atlantic) received 1.90” and Middle Township (Cape May) 1.91”.
Storms worked their way into NJ on the evening of the 1st, with rain continuing into the morning of the 2nd, especially in north and central areas. Rain resumed during the afternoon into the evening, some of it making it south. Figure 2 shows the total rainfall for this multi-stage event, the paths of storms well depicted. The first portion of the event brought a small area of heavy rain to western Morris and eastern Warren counties totaling as much as 4.31” and 3.56” at two Mount Olive gauges. Chester Township (Morris) caught 3.50” and Harding Township (Morris) 3.07”, while 13 locations had 2.00”–2.99” and 89 sites 1.00”–1.99” (out of 270 CoCoRaHS reports). Many southern locations caught nothing in the first round. Round two saw Winslow Township (Camden) catch 1.75”, Monroe Township (Gloucester) 1.55”, and Tenafly (Bergen) 1.32”. Most other locations saw less than 0.55”. Storms in round one downed some trees and power lines in Middlesex County. Round two saw winds gusting to 43 mph at Silas Little (Burlington) and 41 mph at Lower Alloways Creek Township (Salem), with trees and powerlines down at spots in Burlington and Ocean counties.

Figure 2. Precipitation across New Jersey from 8 AM on June 1st through 8 AM June 3rd based on a PRISM (Oregon State University) analysis generated using generated using NWS Cooperative and CoCoRaHS observations. Note the scale in inches beneath the map.
Following a dry week, rain returned late on the 8th into early on the 9th. The majority of NJ received over a half inch in thunderstorms, while the main action was in portions of the southwest, where Mt. Ephraim received 2.18”, Barrington (Camden) 1.73”, and Mansfield (Burlington) 1.70” (Figure 3). Of 264 CoCoRaHS reports, 40 were from 1.00”–1.99” and 129 from 0.50”–0.99”. A 43-mph gust occurred in Lower Alloways Creek Township, with trees falling on cars and homes in Burlington, Gloucester, and Camden counties. Of greatest note was a short-lived EF-1 tornado that cut through a neighborhood in the Pine Hill section of Gloucester Township (Camden). It touched down at 4:59 AM, was 60 yards wide and was on the ground with its estimated 90 mph maximum winds for 0.26 miles. This was New Jersey’s second tornado of 2022. For more information on this and other historical NJ tornadoes, check out our tornado climatology page here.

Figure 3. Precipitation across New Jersey from 8 AM on June 8th through 8 AM June 9th based on a PRISM (Oregon State University) analysis generated using generated using NWS Cooperative and CoCoRaHS observations. Note the scale in inches beneath the map.
Next up was a system that first delivered light rain during the second half of the 11th that became heavier during the morning of the 12th across northern Burlington and Ocean counties before finishing up with scattered showers the second half of the 12th. While the majority of the state receive less than 0.25”, moderate to heavy totals occurred in the aforementioned counties (Figure 4) and in a northern swath. Southampton (Burlington) came in with 2.64”, two Toms River (Ocean) sites received 2.64” and 1.76”, Pine Beach (Ocean) had 2.16”, two Medford Township (Burlington) gauges caught 1.69” and 1.73”, and 33 stations had 1.00”–1.68”.

Figure 4. Precipitation across New Jersey from 8 AM on June 11th through 8 AM June 13th based on a PRISM (Oregon State University) analysis generated using generated using NWS Cooperative and CoCoRaHS observations. Note the scale in inches beneath the map.
The southern tip of NJ saw rain during the morning of the 14th. Three Lower Township (Cape May) stations measured 1.01”, 0.98”, and 0.92”, while North Wildwood had 0.97”. Of 241 CoCoRaHS reports, no other station saw more than 0.42”.
On the 16th, morning thundershowers followed by scattered evening showers were mainly confined to northwest and west-central areas. Frenchtown (Hunterdon) received 1.26”, Mansfield 1.10”, Medford Township 1.04”, and 77 CoCoRaHS stations from 0.50”–0.97”.
An interesting almost due north-to-south flow of showers occurred on the 21st to 22nd. This first deposited light rain in northeast to the northern coast. The action later shifted west, with greater than 0.50” falling in Hunterdon, Warren, and western Sussex counties. Finally, the rain shifted to a more common northwest to southeast track on the 23rd. The full episode brought as much as 1.30” to Newton (Sussex), Montague (Sussex) 1.19”, Andover (Sussex) 1.08”, Hackettstown (Warren), and 0.50”–0.99” at 41 stations. A large majority of NJ locations received less than 0.25”.
June rain finished up during the morning and afternoon of the 27th. Eastern Ocean County saw the heaviest totals with Lacey Township at 2.45”, Berkeley Township 2.20”, and Barnegat 2.12”. Neptune (Monmouth) caught 2.04” (Figure 5). Of 254 CoCoRaHS reports, 37 saw 1.00”–1.99” and 41 from 0.50”–0.99”. The majority of locations, particularly in the north, received less than 0.25”.

Figure 5. Precipitation across New Jersey from 8 AM on June 27th through 8 AM June 28th based on a PRISM (Oregon State University) analysis generated using generated using NWS Cooperative and CoCoRaHS observations. Note the scale in inches beneath the map.
The lowest barometric pressures during June were observed on the 9th and 17th, ranging from 29.55” to 29.65”. Pressures topped out at 30.25” to 30.30” on the 29th.
Wildfire
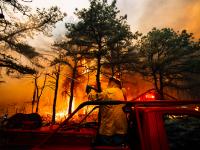
There were two June days with gusty winds that were not mentioned in the previous storm section. These winds played a role in the spread of what became NJ’s largest wildfire since 2007. The strength of the winds is reflected in the gusts at High Point Monument (Sussex) of 47 mph on the 18th and 43 mph on the 19th. Most of the state saw gusts in the 20 mph to 39 mph range these days and into the 20th–21st. The earlier winds helped transfer dry air into NJ and contributed to a drying out of vegetation. Later winds helped to fan the flames and spread a powerful wildfire that originated in the Washington Township (Burlington) portion of Wharton State Forest either later on the 18th or on the 19th, possibly from an incompletely extinguished campfire. While temperatures were not exceedingly high, sunshine was abundant (helping dry the ground), humidity was quite low (especially for mid-June), and then there was the strong northwesterly wind. Named the Mullica River Wildfire by the NJ Department of Environmental Protection’s Forest Fire Service, the fire was intense as seen from the ground (Figure 6) and a satellite channel was able to identify the hot footprint of the fire (Figure 7).
Contained by the 21st, the fire eventually covered over 13,500 acres (final acreage is not yet available), with smoke spreading out to the southeast well out into the Atlantic as seen in a visible satellite image (Figure 8). Smoke was easily recognized on radar imagery (Figure 9). This was New Jersey’s largest wildfire since the Warren Grove fire consumed 15,500 acres in southern Ocean and Burlington counties in mid-May 2007. It is likely to be ranked as the 17th largest back to at least 1926 (see here). Fortunately, it occurred in a sparsely inhabited region, thus no deaths or significant injuries were reported, and no major structures destroyed.

Figure 6. Ground-level photo of the Mullica River fire (NJDEP).

Figure 7. Mullica River fire observed on heat-sensitive satellite image (bright red) on June 20th (NOAA).

Figure 8. Visible satellite image of wildfire smoke at 12:36 PM on June 20th. Clouds are also seen over eastern Cumberland and most of Cape May county southeastward, located south of the smoke plume (NOAA).

Figure 9. Radar image showing the smoke plume at 2:45 PM on June 20th (NOAA).
Another fire on the 26th covered 315 acres. Deemed the Brick Works Wildfire, it occurred in the Manchester Township (Ocean) portion of Brendan Byrne State Forest.
Temperature
Daily maximum temperatures reached at least 85° on 15 June afternoons. Five of those days saw readings of at least 90°. Days with maximums from 85°–89° included the 1st, 2nd, 4th, 8th, 9th, 14th, 15th, 24th, 27th, and 29th. Three of these had highs of 88° or 89°, including 88° at Mannington (Salem) on the 1st, 89° at Cape May Court House (Cape May), Oswego Lake (Burlington), and Sicklerville (Camden) on the 2nd, and 88° at ten NJWxNet stations on the 8th.
The first 90° day was the 13th, when seven stations hit 90°. The 17th was the hottest day of June, with 95° reached at Cape May Court House, Egg Harbor Township (Atlantic), and Vineland, and 43 of the 65 NJWxNet stations topping out from 90°–94° (Figure 10). High Point Monument was coolest at 79°. Heat returned on the 25th, with nine stations reaching 92° and 15 from 90°–91°. Fortescue and Sea Girt (Monmouth) only made it to 81°. Four stations reached 92° on the 26th, with 19 from 90°–91°. A sea breeze only permitted Harvey Cedars (Ocean) to reach 74°. The 30th again saw 92° hit at Lower Alloways Creek Township, Piney Hollow (Gloucester), and Vineland. Eleven stations made it to 90° or 91°.

Figure 10. Maximum temperatures on June 17th based on a PRISM (Oregon State University) analysis generated using NWS, NJWxNet, and other professional weather stations. Note the in 2-degree increment scale beneath the map.
There were eight mornings that cooled to 45° or lower somewhere in the state. On seven of those days, that “somewhere” included the Walpack valley station in Sussex County. Sandyston (Sussex) reached 45° on the 4th. Walpack was 40° and Sandyston 41° on the 5th. Walpack dropped to 42°, Sandyston 43°, and Berkeley Township in the Pinelands also 43° on the 6th. The four-day cool spell ended with Walpack at 44° on the 7th. Another four-day cool interval began with 43° at Walpack on the 18th. Walpack reached 37° on the 19th, while in the far south, West Cape May (Cape May) only dropped to 61°. The 20th was quite a late date to have the coolest morning of the month. However, again, as mentioned in the previous section, humidity levels were unusually low, permitting any warmth from the prior afternoon to escape to space rather easily. Walpack again fell to 37°, Sandyston reached 39°, and ten NJWxNet stations were from 40°–45° (Figure 11). The warming coastal waters helped keep the low at 60° in West Cape May and Lower Alloways Creek Township. The 21st saw Walpack at 42° and Sandyston 45°.

Figure 11. Minimum temperatures on June 20th based on a PRISM (Oregon State University) analysis generated using NWS, NJWxNet, and other professional weather stations. Note the 2-degree increment scale beneath the map.


