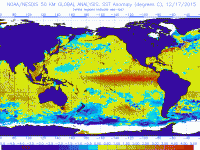
Following a winter of widely-varying conditions, likely in part due to the influence of the major El Niño event that has been underway since last fall, it is useful to look back at past spring weather in years that, like this year, experienced strong El Niños. While certainly not providing a definitive forecast for what we might see over the next several months, this exercise will provide some insights into what might be seen. Here, much as we have done for summer, fall, and winter we will examine the seven strongest El Niño events since 1950.
Looking first at temperature, March was warmer than average in five of the seven years (Figure 1), while for April and May, temperatures tended to be below to well-below average. In fact, only two of the 14 Aprils and Mays averaged more than a half-degree above average, while nine averaged a degree or more below average.
Figure 1: Spring temperature anomalies during past strong El Niños.
Spring precipitation over the last seven strong El Niños was most often above average. Four of the seven Marches saw positive anomalies, with five Aprils and six of the seven Mays on the wet side (Figure 2). The largest anomalies occurred in March and April, and May precipitation was also above average during the very strong 1982-1983 El Niño. Each month during spring 1998 also saw above-average precipitation. The only years that experienced below-average precipitation for most of the spring were the 1965-1966 and 1987-1988 El Niños.
Figure 2: Spring precipitation anomalies during past strong El Niños.
The tendency toward above-average precipitation and clouds associated with such conditions may, at least in part, explain why temperatures have tended to be below average in past El Niño springs. While clouds and precipitation do not necessarily mean cooler temperatures in early spring, with solar insulation on the rise by April and May, cloudy days are often cooler ones.
Another way to get some sense of what spring might bring in terms of temperature and precipitation is provided by the National Weather Service Climate Prediction Center’s spring outlook. As seen in Figure 3, this outlook is leaning toward milder-than-average conditions and sees the coastal Southeast and Mid Atlantic up to NJ favoring wetter-than-average totals.
Figure 3. NWS CPC three-month outlook for temperature (top) and precipitation (bottom) probability.


