Overview
Yet another warmer-than-normal July is in the books. Nine of New Jersey’s 11 hottest Julys dating back to 1895 have occurred since 2010 (Table 1). Unlike last year where the heat was accompanied by the 12th driest July, this year was a wet and humid one, the 22nd wettest on record. The statewide average temperature of 77.2° was 1.8° above the 1991–2020 normal and 3.3° above the 1895–2021 period-of-record mean, ranking 10th warmest on record (tied with 2016). The average high was 87.0°, 1.3° above normal and ranking 18th warmest. The average low was 67.4°, 2.3° above normal and ranking 4th warmest. The northern climate division averaged 75.2° (+1.5°, 12th warmest), the southern division 78.5° (+2.0°, 10th), and the coast 78.3° (+2.1, 8th).
| Rank | Year | July Avg. Temperature |
|---|---|---|
| 1 | 2020 | 78.8° |
| 2 | 2011 | 78.4° |
| 2 | 1999 | 78.4° |
| 2 | 1955 | 78.4° |
| 5 | 2010 | 78.3° |
| 6 | 2019 | 78.0° |
| 7 | 2022 | 77.8° |
| 7 | 2013 | 77.8° |
| 7 | 2012 | 77.8° |
| 10 | 2023 | 77.2° |
| 10 | 2016 | 77.2° |
| 12 | 1949 | 77.0° |
| 13 | 1994 | 76.8° |
| 14 | 2006 | 76.7° |
| 15 | 1988 | 76.5° |
| 15 | 1901 | 76.5° |
Table 1. The 16 warmest Julys across NJ since 1895.
The 6.27” statewide average precipitation was 1.56” above normal to earn the 22nd wettest ranking. The northern division averaged 7.37” (+2.65”, 16th wettest), southern division 5.64” (+0.90”, 30th), and the coast 5.09” (+0.71”, 36th). The largest totals were found in Warren County and adjacent northwest counties, with some totals over a foot (Figure 1). The Pinelands region received the least, with totals of 2.50” to 3.50”.
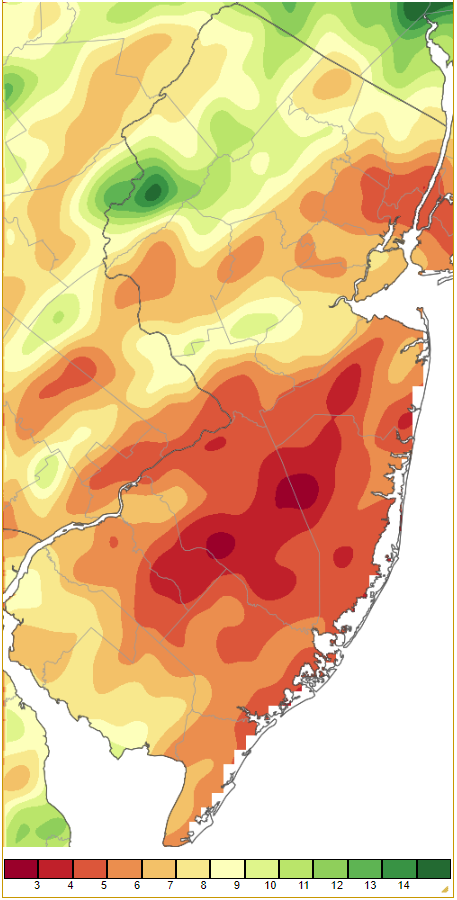
Figure 1. July 2023 precipitation across New Jersey based on a PRISM (Oregon State University) analysis generated using NWS Cooperative, CoCoRaHS, NJWxNet, and other professional weather station observations from approximately 8 AM on June 30th to 8 AM on July 31st. Note the scale in inches at the bottom of the map. Totals range from 2.00”–2.99” (dark red) to 14.00”–14.99” (dark green).
Precipitation and Storms
As discussed above and depicted in Figure 1, there was a factor of five range of July precipitation totals within the state. The wettest locations saw as much as 16.50” in White Township (Warren County). This was followed by Oxford Township (Warren) 16.42", Belvidere (Warren) 15.82” and 12.65” (two stations), Newton (Sussex) 14.46”, and Franklin (Sussex) 13.05”. There were 16 CoCoRaHS stations and 3 NJWxNet stations reporting 10.00”–12.64” within six counties. Meanwhile, the showers were less frequent and less moisture laden in and near the Pinelands, leading to the lowest monthly totals of 2.56” at Winslow Township (Camden), Wall Township (Monmouth) 3.04”, Freehold (Monmouth) 3.18”, Somers Point (Atlantic) 3.35”, Oswego Lake (Burlington) 3.39”, and Burlington (Burlington) 3.44”. Fortunately, values were not low enough to result in major wildfire issues.
There were 14 precipitation episodes in July where multiple stations within either the NJ CoCoRaHS network or the Rutgers NJ Weather Network received more than an inch of rain. The first of these was on July 2nd when evening thunderstorms deposited rain mainly within the Interstate 80 corridor. Hawthorne (Passaic County) with 1.19” and Glen Rock (Bergen) at 1.10” received the most, with little falling further south in the state. The evening of the 3rd until early on the 4th saw rainfall in the southwest. South Harrison (Gloucester) caught 2.40”, Woodstown (Salem) 2.11”, and Glassboro (Gloucester) 1.76”, while little fell elsewhere. Strong winds accompanied the storms, gusting to 46 mph at both Lower Alloways Creek Township (Salem) and Mannington (Salem), 43 mph in Woodbine (Cape May), Dennis Township (Cape May) 42 mph, and Atlantic City Marina (Atlantic) 40 mph.
Afternoon atmospheric fireworks on the 4th delivered 3.20” to Evesham (Burlington), Cranford (Union) 3.08”, Cherry Hill (Camden) 3.33” and 2.87” (two stations), Westfield (Union) 2.74”, Mount Ephraim (Camden) 2.69”, and Haddon Heights (Camden) 2.53”. The rain was heaviest in the NJ Turnpike corridor between Camden (Camden) and Newark (Essex), with 11 stations catching 2.00”–3.20” and 25 from 1.00”–1.99”. Top totals were in Berlin (Camden) 2.98”, Mantua (Gloucester) 2.42”, Red Lion (Burlington) 2.31”, and Pitman (Gloucester) 2.28”. There was some localized flash flooding, small hail reported in Burlington County, and some wind damage to structures, trees, and power lines from Somerset County south to Gloucester County.
The action turned to the northwest on the 9th where, with notable consequences, it resided for the next week (Figure 2). The first heavy event extended from mid-day into the evening. Impressive totals included 5.22” in Califon (Hunterdon), Clinton (Hunterdon) 5.12”, Lebanon (Hunterdon) 5.12”, 4.92”, 4.47”, and 4.45” (four stations), Washington Township (Morris) 4.97”, Belvidere 4.86”, and High Point (Sussex) 4.38”. Fourteen CoCoRaHS stations came in with 4.00”–5.22”, 18 from 3.00”–3.99”, 45 from 2.00”–2.99”, and 47 from 1.00”–1.99”. The rain sent streams and rivers out of their banks in the northern Raritan basin, reaching minor flood stage at locations such as the South Branch of the Raritan in Stanton (Hunterdon). Elsewhere, winds gusted to 45 mph at Cream Ridge (Monmouth) and 40 mph at Lower Alloways Creek Township. A left-over gust on the 10th reached 41 mph at Pennsauken (Camden).
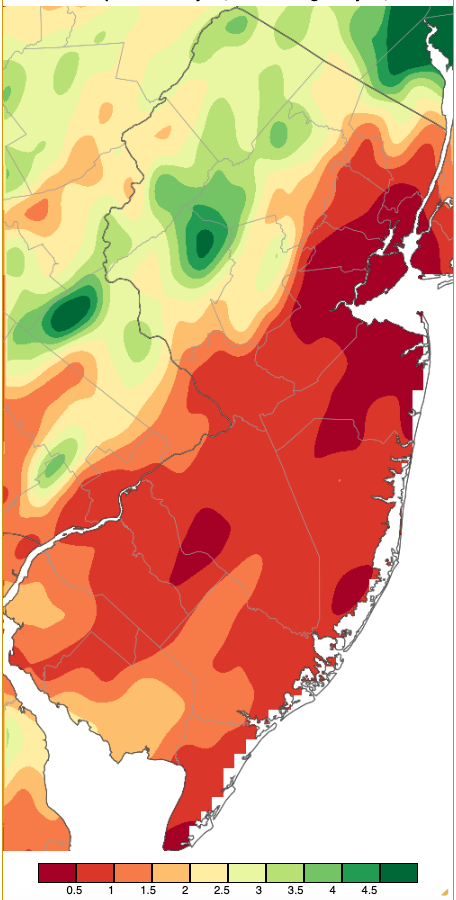
Figure 2. Precipitation across New Jersey from 8 AM on July 9 through 8 AM July 10 based on a PRISM (Oregon State University) analysis generated using NWS Cooperative, CoCoRaHS, NJWxNet, and other professional weather station observations. Note the scale in inches beneath the map.
The next event was quite localized but included the largest storm totals thus far in 2023 (Figure 3). Rain fell at times in the Warren-Morris counties area and elsewhere in northern NJ from the evening of the 13th to the evening of the 14th, the heaviest during the evening of the 14th. White Township was inundated with 8.29”, Oxford 7.03”, Belvidere 5.74”, Newton 5.59”, Pequest (Warren) 4.52”, Rockaway Township (Morris) 4.02”, Liberty Township (Warren) 3.54”, and Knowlton Township (Warren) 3.26”. Some 25 CoCoRaHS stations out of 269 reports came in with 2.00”–2.99”, and 47 from 1.00”–1.99”, though many in the south caught less than 0.50”. Hail up to ¾” in diameter was reported in Sussex County, with reports of tree and wire damage in Passaic, Sussex, Morris, and Somerset counties.
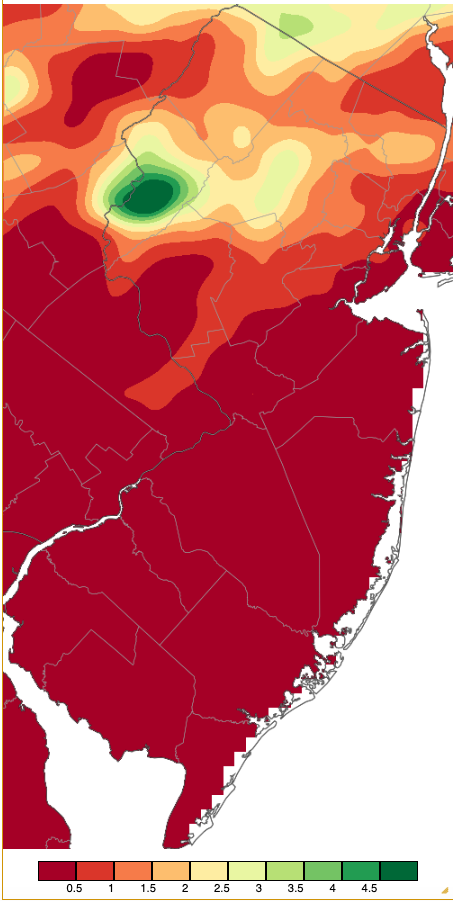
Figure 3. Precipitation across New Jersey from 8 AM on July 13th through 8 AM July 15th based on a PRISM (Oregon State University) analysis generated using NWS Cooperative, CoCoRaHS, NJWxNet, and other professional weather station observations.
Heavy rain and storms focused on a zone from around and just north of Trenton (Mercer) to New Brunswick (Middlesex) during the afternoon of the 15th (Figure 4). The highest totals were found in Ewing Township (Mercer; 4.66”), Hopewell Township (Mercer, 3.82”), Lambertville (3.53”), with 2.00”–3.00” amounts extending eastward towards New Brunswick (3.02”, 3.00”, and 2.86” at three stations). The Millstone River in the southern Raritan basin experienced some minor flooding as a result. Tragically, the same series of storms lead to the deaths of seven just over the Delaware River in Bucks County, as quickly-developing flash flooding waters quickly overtook a road and cars near a creek in Upper Makefield Township.
The beleaguered northwest again saw heavy rain early on the 16th (also reflected in Figure 4). Belvidere stations reported 4.26”, 3.93”, and 3.55”, White Township 3.95”, and Knowlton Township 3.92”. This additional rain was enough to trigger flooding that damaged homes, roads, and bridges in Warren County. A landslide closed a portion of Rt. 46 in the area too and about 100 people were displaced from their homes. The state awaits word on whether a federal Major Disaster Declaration will be issued for the region. The ONJSC contributed to the request effort by supplying a report on the extreme rainfall. The Accompanying the storms was wind damage to structures, trees, and power lines in Sussex and four central counties. A storm in the southwest produced a 41-mph gust at Lower Alloways Creek Township. The three-day rainfall totaled 12.24” in White Township, an amount with an average recurrence interval between 200–500 years.
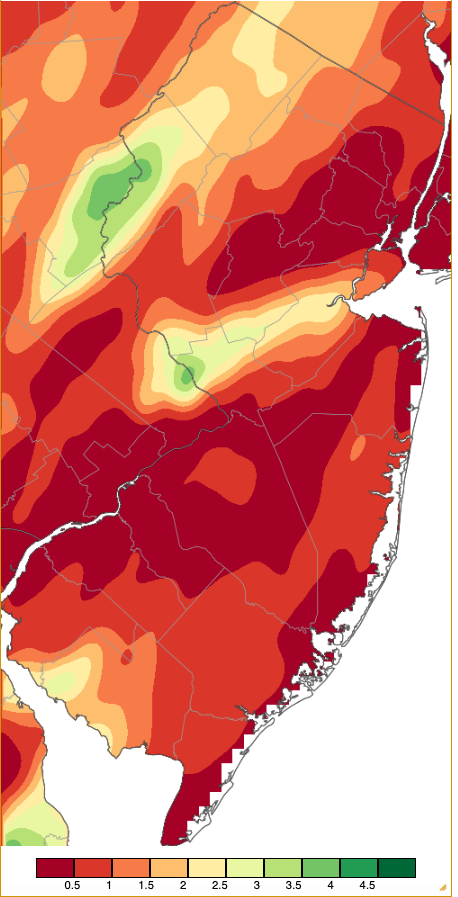
Figure 4. Precipitation across New Jersey from 8 AM on July 15th through 8 AM July 16th based on a PRISM (Oregon State University) analysis generated using NWS Cooperative, CoCoRaHS, NJWxNet, and other professional weather station observations.
Gratefully, daytime and evening rain on the 16th shifted south into portions of central and southeastern NJ. Port Republic (Atlantic) received 2.75”, Barnegat Light (Ocean) 2.43”, Little Egg Harbor Township (Ocean) 2.24”, and Middle Township (Cape May) 2.18”.
Afternoon and evening storms on the 18th brought more than an inch of rain to areas near Raritan Bay and coastal mid-Ocean County. Old Bridge (Middlesex) saw 2.32”, Toms River (Ocean) 2.04” and 1.97” (two stations), Beachwood (Ocean) 1.88”, Pine Beach (Ocean) 1.79”, and Middletown (Monmouth) 1.76”. The vast majority of NJ came in under 0.50”. Showers during the morning and early afternoon of the 19th were not accompanied by much lightning. Rain fell mostly in Monmouth and Cape May counties, totaling 1.42”, 1.39”, and 1.21” in Lower Township (Cape May; three stations), 1.38” in Wildwood Crest (Cape May), and 1.20” at Little Silver (Monmouth). Fortescue (Cumberland) saw a gust of 42 mph.
The northern Highlands and the interior south were the recipients of predawn (north) and daytime (south) storms on the 21st. Of the 12 CoCoRaHS stations coming in with more than an inch, top totals included Millville (Cumberland) 1.90”, Estell Manor (Atlantic) 1.68”, Hamilton (Atlantic) 1.46” and 1.03” (two stations), and Upper Deerfield (Cumberland) 1.66”, 1.38”, and 1.34” (three stations). Gusts reached 41 mph at both Lower Alloways Creek Township and Atlantic City Marina.
A line of storms moved west to east across NJ during the midafternoon and early evening of the 25th, the heaviest rain falling in Somerset and Monmouth counties. Howell (Monmouth) topped the list with 3.52”, followed by Manasquan (Monmouth) 2.80”, Ocean Township (Monmouth) 2.27”, Little Silver 2.23”, Long Branch 2.16”, and 45 other stations from 1.00”–1.89”. The Monmouth and northern Ocean county region had been the driest area of NJ until the last few rain events, thus, unlike up in the northwest where some drying out was welcome, these rains were appreciated. Gusts accompanying the storms reached 49 mph at Fortescue and 44 mph at Hillsborough-Duke (Somerset). Trees were reported down in five northern and central counties.
Light showers dotted the state during the afternoon and evening of the 28th, with heavier evening and overnight storms in the south. Rainfall totals exceeded an inch at three Lower Township stations (1.23”, 1.20”, and 1.18”) and in West Cape May (Cape May) 1.09”. The evening of the 28th saw winds gusting to 55 mph at Lower Alloways Creek Township, Vineland (Cumberland) 52 mph, Fortescue 45 mph, Upper Deerfield 42, Pennsauken 42, and Moorestown (Burlington) 40 mph. Fortescue had a 40-mph gust early on the 29th.
A major shift in airmasses on the 29th was accompanied by an almost unbroken frontal line of storms late in the afternoon and evening. Winds were briefly quite strong in multiple locations with power outages reported. Recorded gusts included 55 mph at Little Egg Harbor Township, Fortescue 52 mph, Atlantic City Marina 48 mph, and six other NJWxNet stations from 40-45 mph. The winds brought down trees and power lines and damaged structures in a number of counties from Sussex to Cape May.
July’s nine days with wind gusts of 40 mph or higher were all mentioned earlier in this section. The maximum barometric pressures of the month were observed on the 24th and 26th, running from 30.10”–30.20”. Lowest pressures were in the 29.70”–29.80” range on the 9th, 10th, and 21st.
Smoky skies appeared on occasion when northwest winds lofted in the smoke from ongoing Canadian wildfires. Not nearly the problem it was weeks earlier, there still was smoke at high altitudes making for a hazy sky on July 1st, 11th, 17th, and 18th. The latter two days saw smoke at low altitudes, decreasing horizontal visibility at ground level.
Temperature
High temperatures at one or more NJWxNet stations reached 90° or greater on 19 July afternoons. This compares to just four this past June and 24 last July. Nine days saw the warmest stations top out from 90°–93°, including the 4th, 7th, 8th, 11th, 14th, 17th, 18th, 23rd, and 26th. The first of the ten days at or above 94° was the 2nd with Piney Hollow (Gloucester) reaching 94°. Moorestown made it to 94° on the 3rd, with 38 of the 67 NJWxNet stations from 90°–93° and Harvey Cedars (Ocean) and High Point Monument (Sussex) the least hot at 81°. Piney Hollow made it to 95° on the 5th with 43 locations from 90°–94°. Moorestown reach 95° on the 6th. The next 94° maximums were at Toms River and Wall Township (Monmouth) on the 12th. A maximum of 95° was achieved at East Brunswick (Middlesex), Hillsborough-Duke, and Moorestown on the 13th with 41 stations at 90°–94°.
The hottest period of the month began in earnest on the 27th with Wall and Fort Dix (Burlington) each reaching 97°. Fifteen stations were 95°–96°, and 31 from 90°–94°. Harvey Cedars was coolest at 81°. This and succeeding days were accompanied by dew points in the 70°s, even reaching the low 80°s for a time at some locations. This brought heat indexes to the 100°–110° range. The 28th was a touch hotter, and top for the month, with Berkeley Township (Ocean) at 97°, 19 stations from 95°–96°, 33 from 90°–94°, and the NJWxNet’s two highest elevation stations of High Point Monument and Vernon Township (Sussex) coolest, yet quite warm, at 85° (Figure 5). The heat broke late on the 29th but not before Seaside Heights (Ocean) and Berkeley Township each rose to 95°, with 44 stations from 90°–94°.
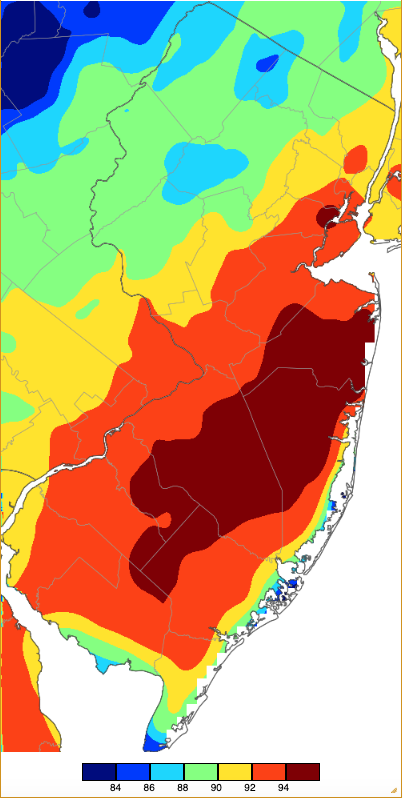
Figure 5. Maximum temperatures on July 28th based on a PRISM (Oregon State University) analysis generated using NWS, NJWxNet, and other professional weather stations. Note the 2° scale beneath the map.
Despite the overall warmth of the month, especially with regard to daily minimum temperatures, there were 12 July days with lows in the 50°s at one or more NJWxNet locations. Berkeley Township fell to 55° on the 1st with 15 stations from 57°–59°. Commonly the cool spot, Walpack (Sussex) had a low of 59° on the 10th. The morning of the 11th found Walpack down to 52°, Sandyston (Sussex) 53°, and 11 locations from 54°–59°. Harvey Cedars only dropped to 73°. Walpack and Sandyston were each 58° on the 12th. A week later on the 19th, Sandyston was 59°.
A five-day run of cooler nights occurred from the 22nd–26th, beginning with 56° at Walpack. Next was a 53° morning at Walpack and Sandyston with 18 locations from 55°–59°. Meanwhile, Harvey Cedars, Atlantic City Marina, and Lower Alloways Creek Township all only fell to 71°. Walpack and Sandyston were 58° on the 24th, High Point Monument and Wantage (Sussex) 59° on the 25th, and Hopewell Township 58° on the 26th.
High Point Monument dropped to 52° and 21 stations from 53°–59° on the 30th. The coolest morning of the month was the last one with Sandyston at 50°, 17 stations from 51°–55°, and 21 from 56°–59° (Figure 6). Three coastal stations only fell to 68°.
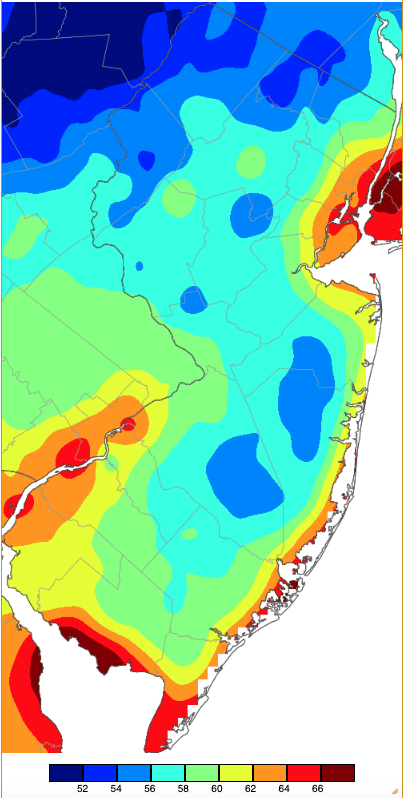
Figure 6. Minimum temperatures on July 31st based on a PRISM (Oregon State University) analysis generated using NWS, NJWxNet, and other professional weather stations. Note the 2° scale beneath the map.


