December Overview
There were multiple faces to December weather around the Garden State. Regionally, the north received above-average snowfall, several episodes of freezing rain, and over two weeks of snow cover, particularly at higher elevations. Central and southern areas saw less snow than average and temperatures a little milder than normal compared to up north. There was also a notable difference between the first and second halves of the month, with the first being stormy and the second having just one storm.
Despite a wintry start to the month, the statewide average temperature of 36.3° was 1.1° above the 1981–2010 normal and ranks as the 29th mildest since 1895 (tied with 2016). The north portion of the state averaged 33.1° (+0.4°), the south 38.2° (+1.6°), and the coast 39.4° (+1.7°). Despite a rather dry second half, the 5.56” of rain and melted snowfall averaged across the state was 1.71” above average, ranking as the 19th wettest (tied with 2012). The coast was wettest, averaging 6.09” (+2.33”), followed by the south with 5.60” (+1.81”), and then the north with 5.44” (+1.49”). Snowfall averaged 3.2”, which was 1.6” below average. The north came in with 8.0”, or 1.4” more than average, while the central area had 3.4” (-2.0”) and the south 0.5” (-3.1”).
Precipitation and Storms
Individual CoCoRaHS and NJWxNet stations observed as much as 9.11” of rain and melted snow during the month in both Red Bank (Monmouth County) and Lacey Township (Ocean), and as little as 3.90” at Fortescue (Cumberland). Among other top totals were two Brick Township (Ocean) sites with 8.82” and 8.29”, Point Pleasant Beach (Ocean) 8.70”, two Stafford Township (Ocean) stations with 8.67” and 7.97”, Wall Township (Monmouth) 8.55”, and Berkeley Township 8.54” (Ocean). On the low side there was also Greenwich (Cumberland) with 4.13”, West Cape May (Cape May) 4.20”, two Blairstown (Warren) sites with 4.21” and 4.44”, two Upper Deerfield (Cumberland) stations with 4.28” and 4.50”, Logan Township (Gloucester) 4.36”, and Dennis Township (Cape May) 4.37”.
CoCoRaHS stations reporting a full month of observations saw as much as 15.0” of snow in Sparta (Sussex), Wantage (Sussex) 14.1”, Montague (Sussex) 13.4”, two Jefferson Township (Morris) stations with 13.3” and 12.6”, Vernon Township (Sussex) 12.4”, and Randolph Township (Morris) 12.3”. A number of stations across the south received less than 1.0” during the month.
A mixed bag of precipitation broke out across the state in the late morning and early afternoon of the 1st, in particular bringing some snow, sleet, and freezing rain to central and northern areas. The frozen mix continued in the north, especially at higher elevations, into the evening before tapering off during the overnight hours. This round of precipitation brought heavy rain to the north and central coast, including 1.90” at Lacey Township, 1.56” in Berkeley Township, 1.55” and 1.17” in Stafford Township, and 1.40” and 1.34” in Toms River (Ocean).
By dawn on the 2nd, precipitation recommenced, mostly as light rain in the south, heavier rain up the coast and in central areas, a mixture of snow and rain in lower elevations further north, and mainly heavy wet snow at higher elevations. Melted snow amounted to 0.97” at West Milford (Passaic) and Montague, and 0.93” in Wantage (Sussex). The snowfall, mainly on the 2nd, along with minor amounts on the 1st, accumulated to over 4.0” at locations in nine northern counties (Figure 1 and Table 1). This included top marks of 15.7” and 14.3” at two Highland Lakes (Sussex) sites. The combination of freezing rain and wet snow led to significant tree damage that resulted in power outages to tens of thousands of customers, inconveniencing some for as long as four days.
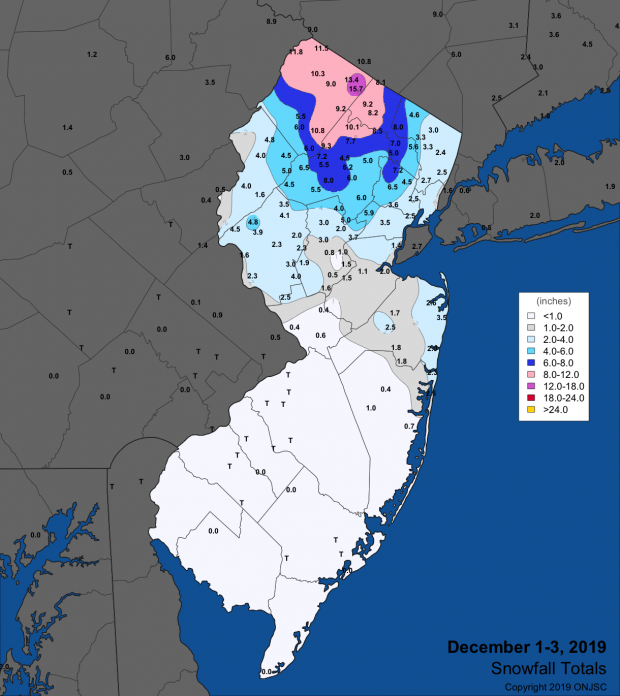
Figure 1. Snowfall from mid-day on December 1st through the early hours of December 3rd. Observations are from CoCoRaHS, NWS Cooperative Observer, and NWS Spotter reports.
| County | Location | Snowfall |
|---|---|---|
| Bergen | Oakland | 8.0” |
| Essex | North Caldwell | 7.4” |
| Hunterdon | Bethlehem Township & Pittstown | 4.8” |
| Morris | Green Pond | 10.1” |
| Passaic | West Milford | 9.2” |
| Somerset | Neshanic Station | 5.0” |
| Sussex | Highland Lakes | 15.7” |
| Union | New Providence | 5.9” |
| Warren | Hackettstown | 5.0” |
Table 1. Largest snowfall in the nine NJ counties where totals on December 1st to 3rd equaled or exceeded 4.0”.
Conditions calmed down for a week before a rapid-fire sequence of four storms arrived from the 9th to 17th. Rain commenced in the predawn hours of the 9th, ending early on the 10th. Totals were heaviest in the Route 1 corridor, with 1.78” falling in Woodbridge (Middlesex), East Brunswick (Middlesex) 1.75”, and both North Brunswick (Middlesex) and Princeton (Mercer) 1.74”. Of the 229 CoCoRaHS reports, 177 were from 1.00”–1.78”, with the remaining 52 from 0.51”–0.99”. The lowest totals were in the northwest and southeast.
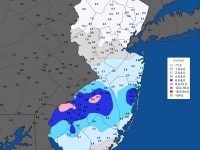
Rain recommenced during mid-day on the 10th, ending as light snow in many areas early on the 11th. Precipitation totals were quite uniform across the state, all within a few tenths of an inch of 0.50”, topped by 0.71” in Lower Township (Cape May) and 0.68” in both Absecon (Atlantic) and Bethlehem Township (Hunterdon; Figure 2). Every county received measurable snowfall, with under an inch in the south, close to an inch with scattered higher totals in central areas, and 1.0”–3.0” totals common in the north, the greater amounts, not surprisingly, at higher elevations. Highland Lakes, with 3.1”, received the most. Stations catching 3.0” included Freehold-Marlboro (Monmouth), Green Pond, Jefferson Township, Mine Hill (Morris), Randolph Township, Sparta, and Stockholm (Sussex).
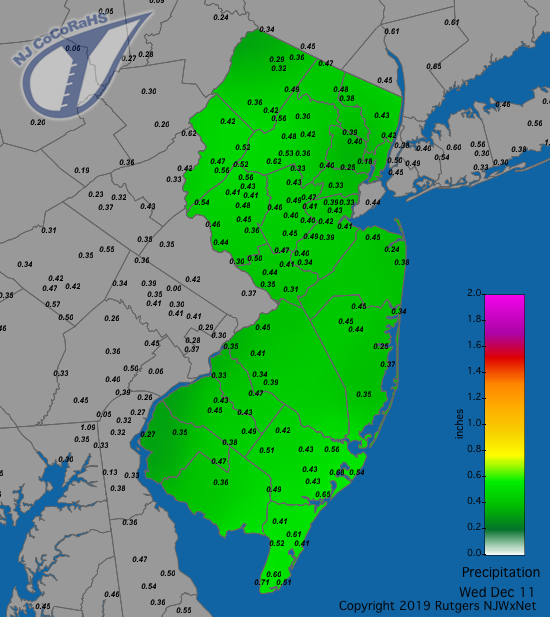
Figure 2. Rainfall from approximately 7AM on December 10th to 7AM on December 11th showing a quite uniform distribution of totals at CoCoRaHS stations.
Another storm moved into the region during the afternoon of the 13th. It brought rain throughout the state that tapered off early on the 14th, though some afternoon showers followed. Unlike previous events, totals differed greatly from east to west (Figure 3). Along the coast, Red Bank caught 2.39”, Absecon 2.30”, Galloway Township (Atlantic) 2.26”, and Linwood (Atlantic) and Point Pleasant Beach each 2.16”. Some 11 stations saw 2.00”–2.39” and 140 from 1.00”–1.99”. On the low end, Peapack-Gladstone (Somerset) only saw 0.40”, two Blairstown stations at 0.49” and 0.53”, and Hackettstown (Warren) 0.50”.
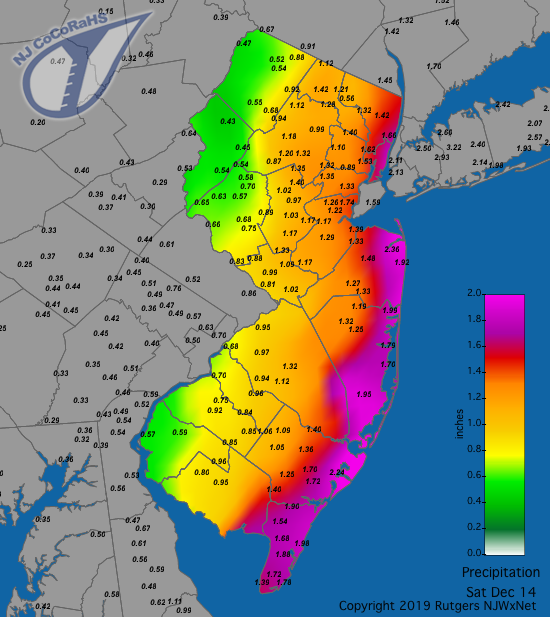
Figure 3. Rainfall from approximately 7AM on December 13th to 7AM on December 14th showing an uneven distribution of totals at CoCoRaHS stations.
The final event in the four-storm sequence extended from later on the 16th into the evening of the 17th. It brought considerable freezing rain to higher elevations in central and northern NJ, but not enough to cause major issues. Pockets of heavy rain included Manchester Township (Ocean) checking in with 1.53”, East Brunswick 1.52”, Winslow Township (Camden) 1.51”, Red Bank 1.51”, and two Stafford stations with 1.51” and 1.48”. Some 122 CoCoRaHS stations picked up 1.00”–1.53”, with under 0.50” falling in portions of the northwest and south. The freezing rain zone for this storm can easily be seen on a wind gust map from the following day (Figure 4). Those areas measuring 0 mph gusts on the map were iced up such that the cups or propellers (the NJWxNet employs two different types of anemometers) were frozen in place. It took several days for enough melting occurred to “free” some of these instruments!
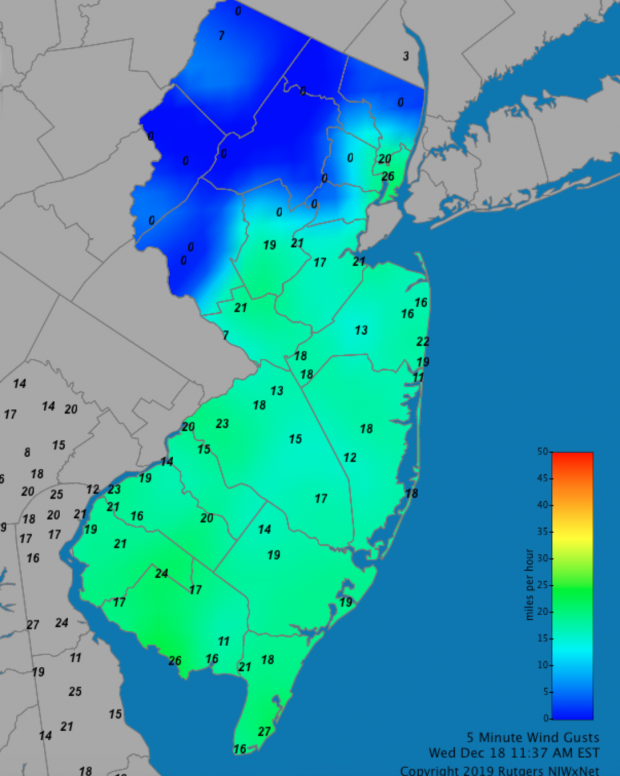
Figure 4. Peak wind gusts reported at NJWxNet, NWS, and Delaware Environmental Observing System stations for the 5-minute period ending at 11:15 AM on December 18th. Those stations reporting 0 mph gusts are indicative of where freezing rain on 16th–17th rendered the anemometers inoperable.
Cold air invaded the state during the afternoon and evening of the 18th. It was accompanied by some impressive quick-hitting snow squalls in northern and central areas. They quickly reduced visibility to dangerous levels on roadways and deposited from several tenths to over an inch of snow in short order. Their distribution was uneven, as witnessed by satellite imagery on the morning of the 19th, showing several west/northwest to east/southeast trending bands of snow across the region (Figure 5).
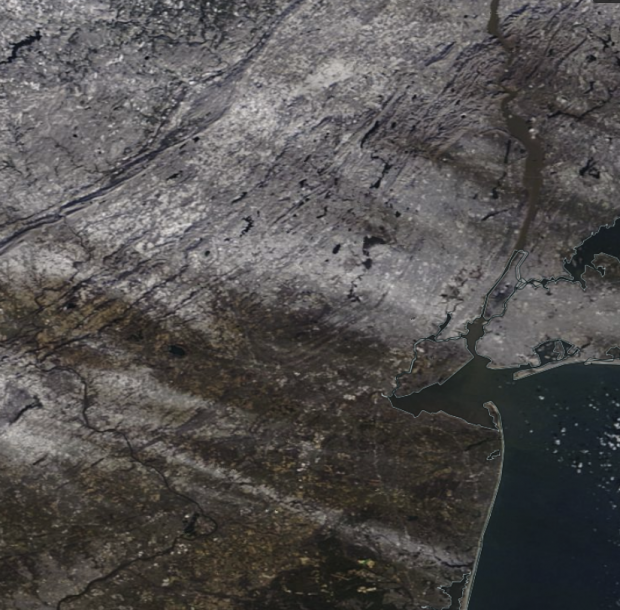
Figure 5. Snow cover across northern and central NJ and surrounding areas on the morning of December 19. Skies over the land are cloud-free, thus the streaks of white of various shades are snow that was laid down in squalls the previous afternoon and evening. Some snow cover toward the north also remains from snowfalls earlier in the month. (NASA MODIS image)
The final storm of 2019 soaked NJ with rain from the afternoon of the 29th to the afternoon of the 30th. Continuing with a common December theme, the northern and central coastal counties caught the most precipitation, led by three Brick Township stations receiving 1.88”, 1.83”, and 1.78”. Lacey Township came in with 1.79”, with two Toms River sites at 1.75” and 1.65”. Some 102 stations caught 1.00”–1.88” and 108 from 0.50”–0.99”. Wildwood Crest (Cape May) saw the least with 0.41”. The highest elevations saw a notable accumulation of freezing rain during this event, especially at High Point State Park (Sussex).
The lowest barometric pressure during December was observed on the 14th at a rather low 29.15”–29.25”. Just two days earlier, the barometer had been at an impressive high mark close to 30.70”–30.75”.
Seven days found one or more NJWxNet station with a wind gust exceeding 40 mph. Sea Girt (Monmouth) had the peak monthly gust of 51 mph on the 1st, when Cream Ridge (Monmouth) came in at 46 mph, Berkeley Township 45 mph, and Point Pleasant (Ocean) 40 mph. Sea Girt reached 41 mph on the 2nd and Point Pleasant 46 mph on the 3rd. The 15th found gusts to 42 mph in Stewartsville (Warren) and 40 mph at both Sea Girt and Hillsborough-Duke (Somerset). While northwestern anemometers remained mostly iced up on the 18th, elsewhere, Pennsauken (Camden) gusted to 46 mph, Moorestown (Burlington) and Upper Deerfield each reached 43 mph, and the 41 mph mark was achieved at Harvey Cedars (Ocean), Fortescue, and Sea Girt. The 19th brought a 44 mph gust to Sea Girt with 41 mph at Mullica (Atlantic) and 40 mph in Fortescue. Sea Girt gusted to 41 mph on the 30th.
Temperature
The thermometer bounced around quite a bit during December. Maximum temperatures exceeded 55° at one or more NJWxNet station on 12 days, with the largest gap between such observations from the 15th–22nd. Minimum temperatures fell to 15° or colder on ten days, the largest gap being the last six days of the year. Two days, the 1st and the 25th, found different locations exceeding 55° and falling below 15°.
Southern NJ was mild on the 1st, with Cape May Court House (Cape May) reaching 57° and three stations up to 56°. Meanwhile, the daily maximum was only 27° at High Point Monument (Sussex). Cape May Court House reached 56° on the 6th. This location got to 61° on the 9th, with five other sites topping out at 59°. The 10th was the month’s mildest day, with Cape May Court House up to 66°, Egg Harbor Township (Atlantic) 64°, 18 stations from 60°–63°, and 32 from 55°–59° (out of 62 stations). Four locations reached 57° on the 13th, with Silas Little (Burlington), Toms River, and Berkeley Township each at 60° on the 14th.
Haworth (Bergen) and Walpack (Sussex) hit 59° on the 23rd, with 31 other stations from 55°–58°. Walpack began that day at 16°, thus scored the rare achievement of having both the state’s highest and lowest temperature of the day! Cape May Court House led the way on a mild Christmas day with a high of 55°. A four-day run of mild conditions began on the 27th with Cape May Court House up to 59° and Point Pleasant, Egg Harbor Township, and Toms River each at 58°. Vineland (Cumberland), Woodbine (Cape May), and Egg Harbor Township all reached 61° on the 28th, with 25 stations from 55°–60°. Dennis hit 56° and Woodbine 55° on the 29th. A warm southern day brought the thermometer up to 64° at Woodbine on the 30th with a 42° minimum. Dennis reached 63°, Vineland 60°, and eight locations 55°–59°. Meanwhile, High Point Monument was locked in ice with a high of only 32° and a minimum of 30°.
The 1st found High Point Monument down to 14°, while along the coast, Harvey Cedars only fell to 37°. Sandyston (Sussex) was 13° on the 7th, with High Point (Sussex) and Walpack at 14°. Sandyston chilled to 6° on the 8th, with Walpack at 8° and 13 locations from 11°–15°, while Harvey Cedars and Atlantic City Marina (Atlantic) barely dropped to freezing at 31°.
Walpack was 12° on the 12th, followed by four stations at 14°–15°. A five-day run of sub-10° cold began on the 18th, with cold air blowing into NJ dropping High Point Monument down to 8° and High Point 10°. A monthly low of 5° occurred at the Monument on the 19th, with High Point 7°, Sandyston 9°, and 21 stations from 10°–15°. Almost equaling this cold was the 20th, when the coldest air settled into northwestern valleys, dropping Walpack to 7°, Pequest (Warren) 9°, Sandyston 10°, and 19 sites at 11°–15°. Walpack fell to 8° on the 21st, with Sandyston and High Point at 9°. Walpack was again 8° on the 22nd. Christmas morning found Walpack down to 13° and Pequest 15°.
Annual overview, including the ONJSC’s Top 10 NJ Weather and Climate Events of 2019
Overview
The statewide annual temperature of 54.3° was 1.4° above the 1981–2010 average and tied with 2002 as the 10th warmest since 1895. This is 2.5° above the 1895–present average, indicative of the increasing warmth over the past several decades. 14 of the 20 warmest years of the past 125 have occurred this century and 18 since 1990.
| Rank | Year | Annual Avg. Temp. |
|---|---|---|
| 1 | 2012 | 55.9° |
| 2 | 1998 | 55.2° |
| 3 | 2016 | 55.0° |
| 3 | 2006 | 55.0° |
| 5 | 2011 | 54.9° |
| 6 | 2010 | 54.7° |
| 7 | 2017 | 54.6° |
| 8 | 1990 | 54.5° |
| 9 | 1991 | 54.4° |
| 10 | 2019 | 54.3° |
| 10 | 2002 | 54.3° |
| 12 | 2018 | 54.2° |
| 13 | 1999 | 54.1° |
| 14 | 2015 | 53.9° |
| 14 | 1949 | 53.9° |
| 16 | 2008 | 53.6° |
| 16 | 2007 | 53.6° |
| 16 | 2001 | 53.6° |
| 19 | 2005 | 53.5° |
| 19 | 1953 | 53.5° |
Table 2. The 20 warmest years across New Jersey since 1895.
The average maximum temperature in 2019 was 64.1°. This was 1.1° above average and ranks 15th warmest. The statewide average minimum was 44.5°, which was 1.7° above average and ranks 9th warmest. Ten months averaged above normal. An impressive four were in the top ten, including April (4th), July (5th), September (9th), and October (8th). The summer (June–August) was 5th warmest.
Statewide precipitation in 2019 averaged 51.93”. This is 5.57” above the 1981–2010 mean and ranks as the 17th wettest of the past 125 years. Northern NJ was wettest in terms of both total (56.93”) and departure (+8.30”), ranking 14th wettest. The south averaged 49.00” (+3.95”) with a ranking of 26th wettest. Coastal areas came in at 47.38”, which is 3.19” above average and ranks 32nd wettest. Seven months had above-average precipitation, including the 9th wettest May. September was the 7th driest on record, briefly raising some drought concerns.
The five wettest CoCoRaHS stations in 2019 were Stafford Township (Ocean County) at 69.16”, Rockaway (Morris) 68.69”, Mine Hill (Morris) 68.48”, Washington Township (Morris) 67.71”, and Blairstown (Warren) 67.65”. Some 56 CoCoRaHS stations accumulated more than 60.00”. On the dry side, Wildwood Crest (Cape May) caught 37.57”, Upper Deerfield (Cumberland) 42.60”, Middle Township (Cape May) 44.67”, Egg Harbor Township (Atlantic) 45.85”, and Woodstown (Salem) 46.02”.
Snowfall for the calendar year was 18.6”, which is 5.1” below the 1981–2010 normal and 8.2” below the 1895–present mean. This included 13 events in 2019 where one or more location in the state received at least 2.0”.
Top 10
For the 11th consecutive year, we in the state climate office have evaluated the myriad of daily, monthly, and annual observations gathered across New Jersey during the course of the year to choose what we feel were the most significant and impactful 10 weather and climate events. More about each event can be found in the monthly narratives posted on njclimate.org. You might be tempted to rearrange the rankings, particularly as some of the events on the list may have affected you more than others ranked higher. Or perhaps you best recall one that didn't make the list. That's the enjoyment and frustration of lists! Unless stated otherwise, statewide values are based on an average of several dozen stations. The period of record for monthly, seasonal, and annual departures is 1981–2010; while for extremes and rankings it is from 1895–present. Observations are mainly drawn from National Weather Service Cooperative Observing Program stations, Rutgers NJ Weather Network stations, and NJ Community Collaborative Rain, Hail and Snow Network locations.
- Tenth warmest year
- Annual: Statewide average temperature of 54.3° is 1.4° above average and ties with 2002 as the 10th warmest.
- Seasonal: 5th warmest summer (June–August).
- Monthly: 10 months above average. Four months in the top 10 for warmth(April 4th, July 5th, September 9th, October 8th).
- Second most tornadoes
- Nine during the year ties 1987 for second most since 1950 (record 17 in 1989).
- All were rather weak and short-lived, having EF0 or EF1 ratings.
- While there was some damage with each, no major injuries were reported.
| Date | Town (county) | EF rating |
|---|---|---|
| May 28 | Stanhope (Sussex) | 1 |
| June 13 | Mullica Hill (Gloucester) | 0 |
| June 13 | Gloucester Township (Camden) | 1 |
| July 6 | Mount Laurel (Burlington) | 0 |
| July 11 | Mount Laurel | 1 |
| August 7 | Springfield (Union) | 0 |
| August 7 | Hightstown (Mercer) | 0 |
| August 7 | Millville (Cumberland) | 0 |
| November 1 | Madison (Morris) | 1 |
- Seventeenth wettest year
- Statewide average precipitation was 51.93”, which is 5.57” above average and ranks as the 17th wettest.
- May was the 9th wettest on record.
- The 12-month period ending in January (February 2018–January 2019) was the wettest 12-month interval of any back to 1895. The 12 month period ending in July 2019 was the second wettest. There have been 1489 12-month intervals over the past 125 years of observations.
- Windy
- Ten months had at least one day with winds gusting to 50 mph at NJWxNet stations (23 days total). The table below shows the: date (peak gust in mph/number of stations gusting to 50 mph or higher).
| January | 10th (50/4) | 20th (50/1) | 30th (50/1) | ||
| February | 24th (55/6) | 25th (61/14) | |||
| March | 22nd (62/3) | 23rd (63/2) | |||
| April | 3rd (56/1) | 15th (81/12) | 20th (50/1) | 26th (60/2) | 27th (52/3) |
| May | none | ||||
| June | 2nd (56/1) | 29th (54/1) | |||
| July | 17th (57/3) | 21st (51/1) | 22nd (59/11) | ||
| August | 19th (78/1) | ||||
| September | none | ||||
| October | 16th (59/5) | 17th (64/2) | |||
| November | 1st (62/8) | 27th (52/2) | |||
| December | 1st (51/1) |
- Southwest flooding
- From heavy rains on June 19th–20th.
- Heaviest county totals were 8.03” in Tabernacle (Burlington), 5.42” in West Deptford (Gloucester), and 4.60” in Cherry Hill (Camden). Medford Lake (Burlington) had the second highest total with 5.76”.
- Damaged homes and infrastructure from flash and river flooding. Several dams were topped.
- Short fall
- Quick transition from late-summer heat in early October to early-winter cold in early November.
- Maximum temperatures on October 2nd were as hot as 97° in Moorestown (Burlington), with 42 NJWxNet stations topping out from 90°–96°.
- Minimum temperatures on November 9th were as cold as 11° at Walpack (Sussex), with 36 stations bottoming out from 12°–20°.
- The 95° maximum on the afternoon of October 2nd was the hottest for so late in the warm season at New Brunswick (Middlesex) with records back to 1893. The 19° at this station on the morning of November 9th was the coldest for so early in the cold season.
- Late July heatwave and back-breaking squall line
- Some locations topped the 90° mark each day from July 16th–22nd.
- Peak heat was on the 20th, with 100° reached in Harrison (Hudson), Point Pleasant (Ocean), and Hawthorne (Passaic). Also on the 21st, with 101° at Point Pleasant, Sea Girt (Monmouth), Seaside Heights (Ocean), and Harrison, and 100° in Pomona (Atlantic).
- Strong squall line broke the heat on the 22nd, with 4.15” of rain at Wantage (Sussex) and 4.01” in Edison (Middlesex). Quarter to golf ball size hail fell in parts of Morris, Passaic, and Bergen counties. Eleven NJWxNet stations gusted from 51–59 mph.
- Wind damage was most severe in Monmouth County, followed by Ocean and Burlington counties. Power was out to 300,000 customers.
- Early fall flash drought
- September was the 7th driest on record.
- The lack of rain, combined with 9th warmest September temperatures, resulted in a quick transition from what had been a wet/green summer to quickly growing concerns for wildfire, agriculture, and water resources.
- October rainfall was 2.00” above average, rather quickly alleviating the potential for longer-term drought conditions.
- Stafford Township deluges
- Three CoCoRaHS observers in this Ocean County community observed excessively heavy July rain on the 6th and 13th.
- Totals for the first event were 5.70”, 4.06”, and 3.25”.
- Totals for the second event were (in the same order of stations) 5.50”, 3.27”, and 3.05”.
- March snowiest month
- For an unprecedented 3rd consecutive year, March had more snow across the state than any other month.
- While the statewide average was just 6.3” (+2.1”), it still beat out the second largest month of 5.3” in February.


