Overview
When it comes to cold and snow, the second month of winter wasn’t anything like the first. New Jersey was right in the heart of winter to start off 2022, and nowhere was that more apparent than in southern coastal counties where far more than an average winter’s snow fell. At some locations, the total exceeded that of the most recent three winters combined. The prevailing storm track was such that the northwest corner of the state received the least snow, yet saw seven days with low temperatures dipping below zero. Toss in 15 days where one or more locations around the state recorded wind gusts of 40 mph or greater (five of these with gusts of at least 50 mph) and two atmospheric pressure waves moving across the state as a result of a volcanic eruption in the south Pacific, and it certainly was an eventful month.
Rain and melted snow averaged 3.45” across the state (Figure 1). This is 0.04” below the 1991–2020 normal and ranks as the 54th wettest (75th driest) January since 1895. The northern counties south to and including Hunterdon, Somerset, and Union averaged 2.90”, 0.60” below normal and 75th wettest (53rd driest). Southern counties, except close to the Atlantic Coast, averaged 3.72”, which is 0.25” above normal and ranks 46th wettest. The coastal region caught 4.34”, which is 0.83” above normal and ranks 31st wettest. Persistent dry conditions in recent months resulted in the southernmost NJ counties deemed “Abnormally Dry” for most of the month, according to the National Drought Monitor. As the month ended, northwestern counties were under consideration for being similarly designated.
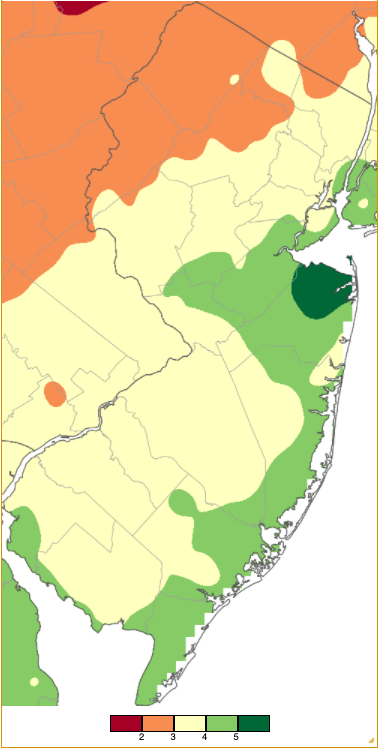
Figure 1. January 2022 precipitation across New Jersey based on a PRISM (Oregon State University) analysis generated using NWS Cooperative and CoCoRaHS observations from 7AM on December 31, 2021, to 7AM on January 31st. Note the scale in full inches at the bottom of the map. Totals range from 1.00”–2.00” (dark red) to 5.00”–6.00” (dark green).
Snowfall averaged 18.1” across NJ. This is 11.0” above normal and ranks as the 9th snowiest January since 1895. The southern counties averaged 23.9” (Ocean and Burlington and southward: note the difference between the county breakdown for precipitation and temperature). This is 18.3” above normal and ranks as the second snowiest January since 1895 (Table 1). Four of the top 10 have been since 2011. Central counties (Middlesex, Monmouth, Mercer, Hunterdon, Somerset, and Union) averaged 12.0” (+4.3”, 32nd snowiest). Counties to the north averaged 13.0” (+3.7”, 33rd snowiest).
| Rank | Year | Jan. Avg. Snow |
|---|---|---|
| 1 | 1918 | 24.1” |
| 2 | 2022 | 23.9” |
| 2 | 1905 | 21.1” |
| 4 | 1987 | 19.8” |
| 5 | 2016 | 18.7” |
| 6 | 2014 | 18.1” |
| 7 | 1935 | 17.4” |
| 8 | 1912 | 17.1” |
| 9 | 2011 | 17.0” |
| 10 | 1996 | 15.5” |
Table 1. The ten snowiest Januarys in southern New Jersey since 1895.
The statewide average January temperature of 28.7° was 3.0° below normal. It ranked 49th coldest of the past 128 years. January was 12.7° colder than December when, on average, a difference of 4.9° is expected. The north averaged 25.4°, which is 3.5° below normal and 46th coldest, the south 30.6° (-2.8°, 50th coldest), and coast 31.4° (-3.0°, 52nd coldest). Statewide daily maximum temperatures averaged 37.9° (-2.4°, 55th coldest) and the minimums averaged 19.4° (-3.8°, 41st coldest).
Precipitation and Storms
From the above discourse, it is apparent that the south and the coast led the way in the precipitation department in January. Individual NJ CoCoRaHS stations received as much as 5.59” of rain and melted snow at Galloway Township (Atlantic County). This was followed by Lower Township (Cape May) at 5.50” and another station there at 5.11”, Salem (Salem) with 5.47”, Middle Township (Cape May) with 5.40” and 5.35”, and Old Bridge (Middlesex) 5.21”. Lowest northwest totals included Montague (Sussex) with 1.95”, Newton (Sussex) and Blairstown (Warren) each with 2.11”, Stillwater Township (Sussex) 2.12”, Andover Township (Sussex) 2.47”, Frelinghuysen Township (Warren) 2.58”, and Sparta (Sussex) 2.67”.
Individual monthly snowfall totals were as large as 36.0” and 34.9” at two Galloway Township locations, Brigantine (Atlantic) caught 32.1”, Stafford Township (Ocean) 30.0”, Ocean City (Cape May) 26.5”, Berkeley Township (Ocean) 25.7”, and Maurice River Township (Cumberland) 25.3”. On the short end, Stillwater Township (Sussex) only accumulated 7.3”, Mount Olive Township (Morris) and Andover (Sussex) each with 7.4”, Raritan Township (Hunterdon) 7.5”, and Franklin Township (Hunterdon) 8.0”. The NWS Atlantic City Airport station in Pomona (Atlantic) received 33.2” for the month. This was 27.4” above normal, was the greatest January snowfall total since records commenced in 1958 by an impressive 12.9”, and tied for the 3rd highest of any monthly total (record is 36.6” in February 2010). This month alone would rank this winter as the 11th largest snow season on record at this location (no snow fell earlier this winter).
The first precipitation event of the year was a wet one from the afternoon of the 1st into the 2nd. The central counties received the most rainfall, topped by Hillsborough Township (Somerset) at 1.52”, followed by Old Bridge with 1.49”, Matawan (Monmouth) 1.43”, Hopewell (Mercer) 1.39”, and Hopewell Township (Mercer) 1.37” (Figure 2). Of 235 CoCoRaHS reports, 34 were over 1.00”.
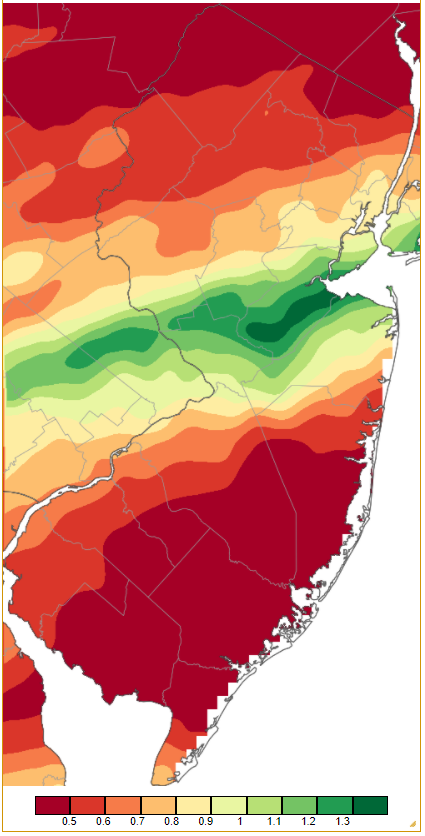
Figure 2. Precipitation across New Jersey from 7AM on January 1st through 7AM January 2nd based on a PRISM (Oregon State University) analysis generated using generated using NWS Cooperative and CoCoRaHS observations. Note the scale in inches beneath the map.
As colder air invaded NJ, snow commenced in the south on the 3rd, leaving hefty totals before departing (Figure 3). Moisture never made it northward of Burlington and Ocean counties leaving the south brightly snow covered and elsewhere brown (Figure 4). Nine counties received measurable snow (0.1” or more), with six having at least one location with 5.0” or more. Topping the list were 14.8” totals in Galloway Township and Somers Point (Atlantic). The most that fell in counties where at least 5.0” accumulated also included 14.0” at Ocean City, Maurice River Township 11.0”, Barnegat Township (Ocean) 10.1”, Franklin Township (Gloucester) 7.5”, and Salem (Salem) 5.9”. There was some minor flooding along the coast.
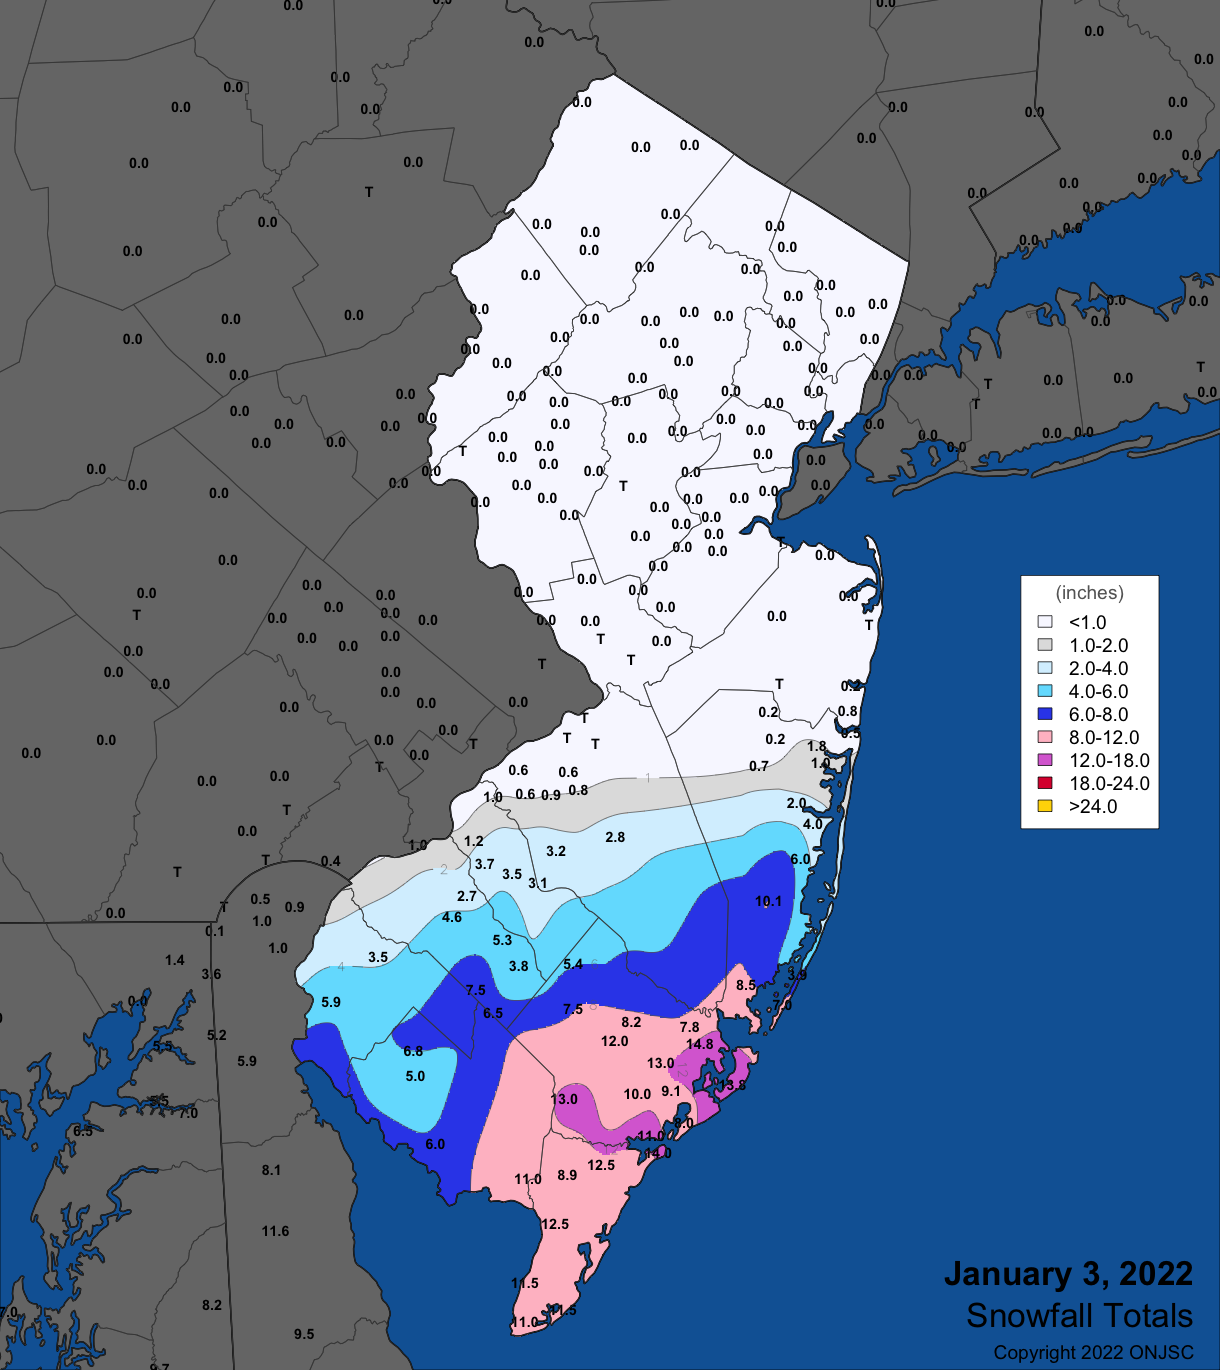
Figure 3. Snowfall on January 3rd. Observations are from CoCoRaHS, NWS Cooperative Observer, and NWS Trained Spotter reports.
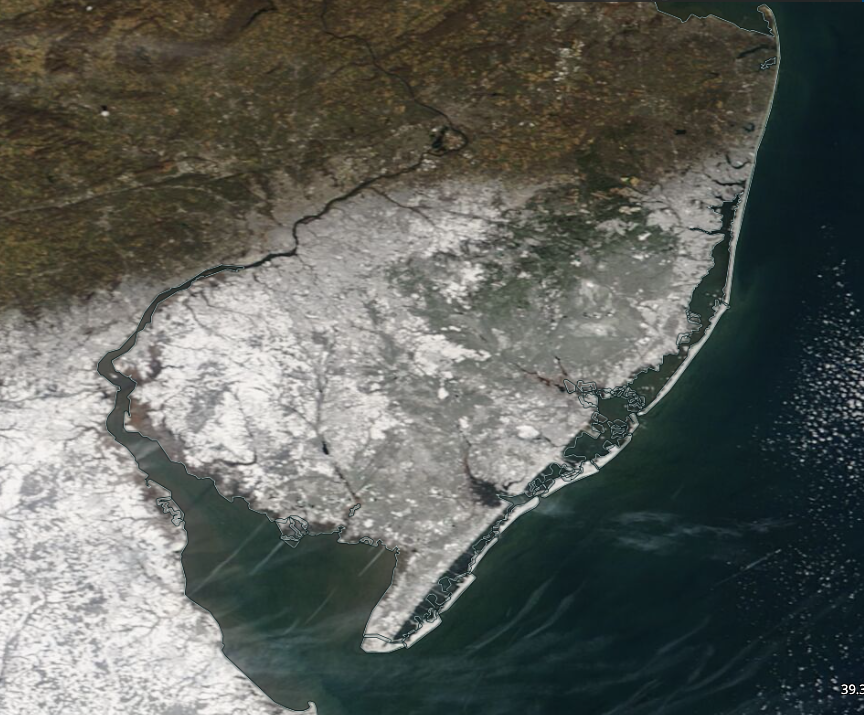
Figure 4. NASA MODIS visible satellite image showing snow cover across south Jersey and portions of Delaware on the morning of January 4th.
Some very light freezing rain fell on the morning of the 5th. It was enough to result in accidents in a number of northeastern counties and south to Burlington and Ocean counties. Snow began again late on the 6th, tapering off by early afternoon on the 7th. This time, snow was dispersed quite evenly across NJ. At least 3.0” fell in every county and 17 saw 5.0” or more (Figure 5). At opposite ends of the state, the lower coast and northwest received the least. Monmouth County had three locations with as much as 6.1” (Eatontown, Freehold, and Holmdel), Tenafly (Bergen) had 6.1”, and nine locations in nine other counties saw 6.0”, including Hillsdale (Bergen), Berlin (Camden), Upper Deerfield (Cumberland), North Caldwell (Essex), Franklin Township (Gloucester), Ocean Township (Monmouth), Jackson Township (Ocean), Somerville (Somerset), and Plainfield (Union).
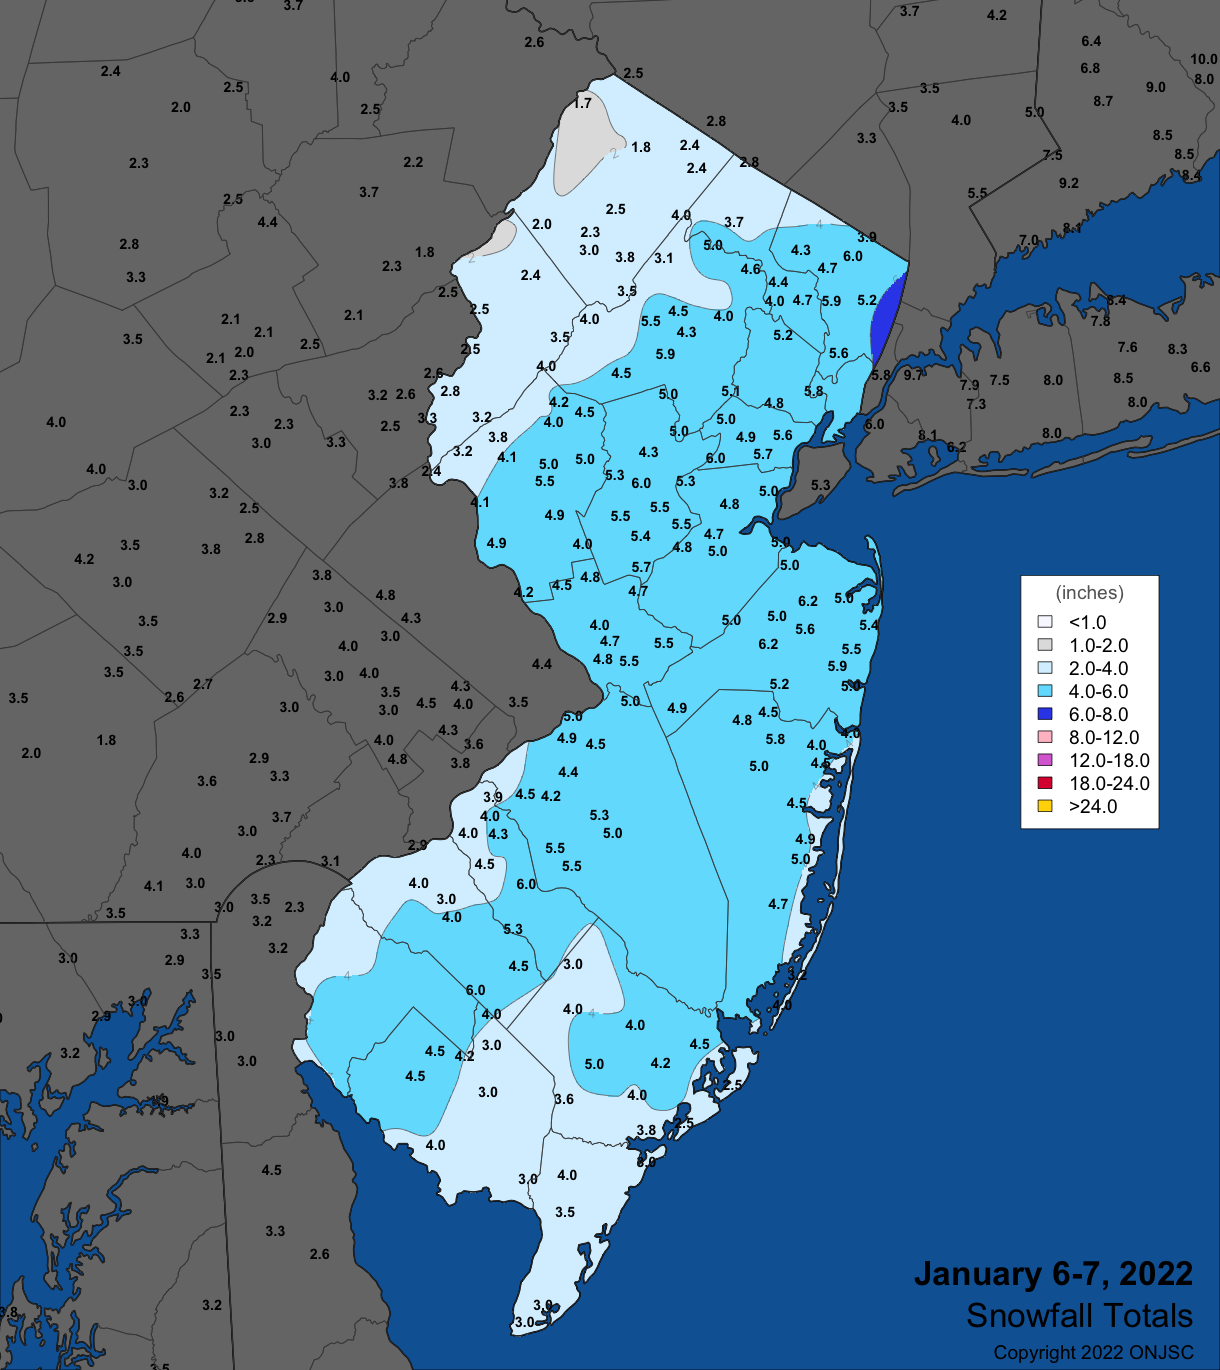
Figure 5. Snowfall on January 6th–7th. Observations are from CoCoRaHS, NWS Cooperative Observer, and NWS Trained Spotter reports.
The wettest storm of the month brought an impressive potpourri of conditions across the state. Rain spread northward beginning in the south late on the afternoon of the 16th. At first there was some snow and sleet, but, except in the northwest, it quickly changed to rain. Heavy rain fell in the overnight hours, and thunderstorms moved up the coast, with locally strong winds toppling trees in several areas and some hail reported in a few locations. The storm ended with snow showers scattered around the state during the afternoon of the 17th. Rain and melted snow totaled as much as 2.23” in Red Bank (Monmouth), Cranford (Union) 2.18”, North Arlington (Bergen) 2.01”, and Old Bridge and Montville (Morris) each with 2.00”. Virtually the entire state received between 1.00”–2.00” of moisture, with 215 of the 234 CoCoRaHS reports coming in between 1.00”–1.99” (Figure 6). The lowest total was 0.73” in Mount Olive. Despite being mainly a rain event, 17 counties had one or more stations receive measurable snow, with at least 2.0” in eight counties (Figure 7). However, only Sussex and Morris had locations over 5.0”, including Wantage (Sussex) with 7.0” and 6.4” reports, Montague 6.5”, Green Pond (Morris) 5.5”, and Jefferson Township (Morris) 5.3”.
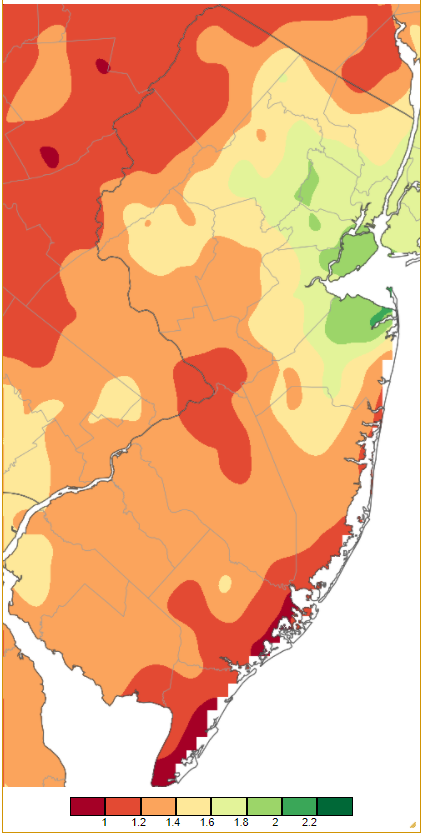
Figure 6. Precipitation across New Jersey from 7AM on January 16th through 7AM January 18th based on a PRISM (Oregon State University) analysis generated using generated using NWS Cooperative and CoCoRaHS observations. Note the scale in inches beneath the map.
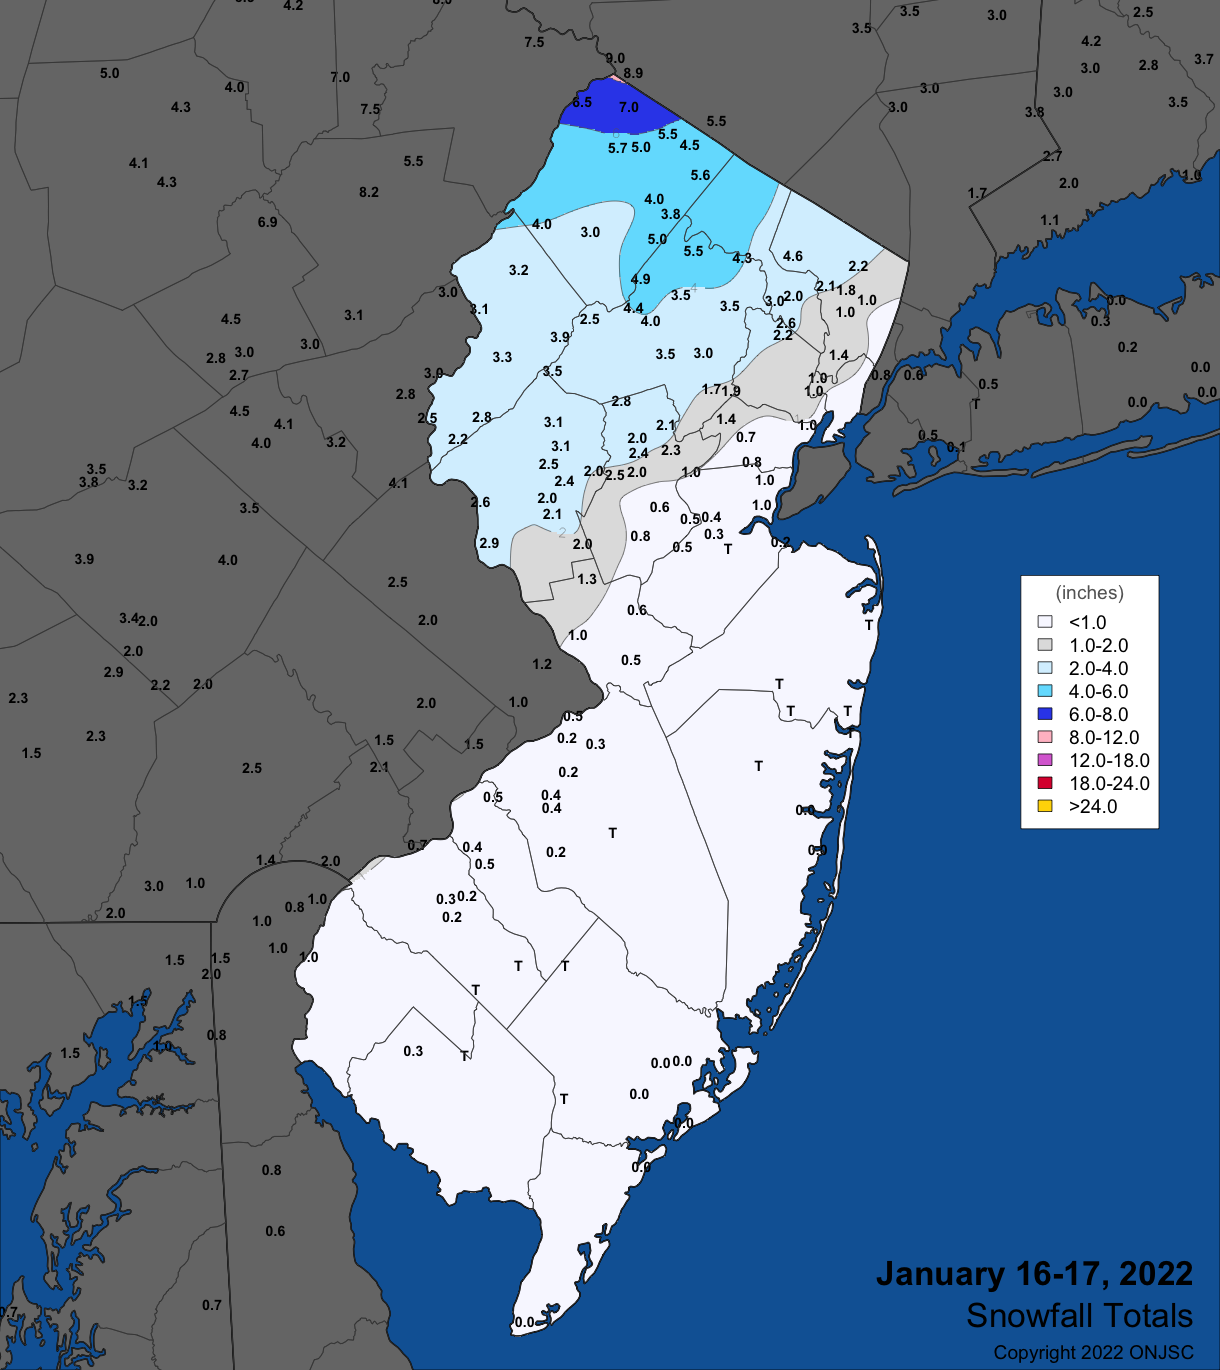
Figure 7. Snowfall on January 16th–17th. Observations are from CoCoRaHS, NWS Cooperative Observer, and NWS Trained Spotter reports.
The grand finale of this active month was a blockbuster snowstorm that pummeled coastal counties. Accompanied by strong winds and increasingly cold temperatures, blizzard conditions prevailed for a time at the coast. A blizzard is defined as three or more consecutive hours of horizontal visibility less than a quarter of a mile in falling or blowing snow, accompanied by sustained wind speeds or frequent gusts to 35 miles an hour or greater. The storm began with some light snow falling in central and northern areas during the daylight hours of the 28th. The main event began during the evening as some early rain in the south quickly turned to snow. Snow continued along the northern coast and in the northeast into the afternoon of the 29th, with winds blowing and drifting the snow throughout the state. Given the wind, it was a difficult snowfall to measure, however, thanks to many dedicated observers, there is confidence in the snow totals depicted in Figure 8. Table 2 reports the highest total in each county, led by 18.4” in Manasquan (Monmouth), 18.3” in Lacey Township (Ocean), and 17.5” at Galloway Township. Seven counties had 10.0” or more. The least snowfall was 1.6” in Montague. The entire state was brightly covered with snow on the 30th, though some of it was hidden under the dense conifers in the Pinelands and in other forested locations (Figure 9).
Melted precipitation amounted to as much as 2.04” in Brigantine, 1.94” and 1.69” at two Galloway Township locations, Pine Beach (Ocean) 1.69”, Wall (Monmouth) and Long Branch (Monmouth) each with 1.50”, and Point Pleasant Beach (Ocean) 1.47”. Least was the 0.19” in Knowlton Township (Warren) and 0.20” at Montague (Figure 10). Minor coastal flooding occurred but more significant problems were avoided as a result of generally northwest to north winds (not northeast to east) during the storm and the relatively quick motion of the storm.
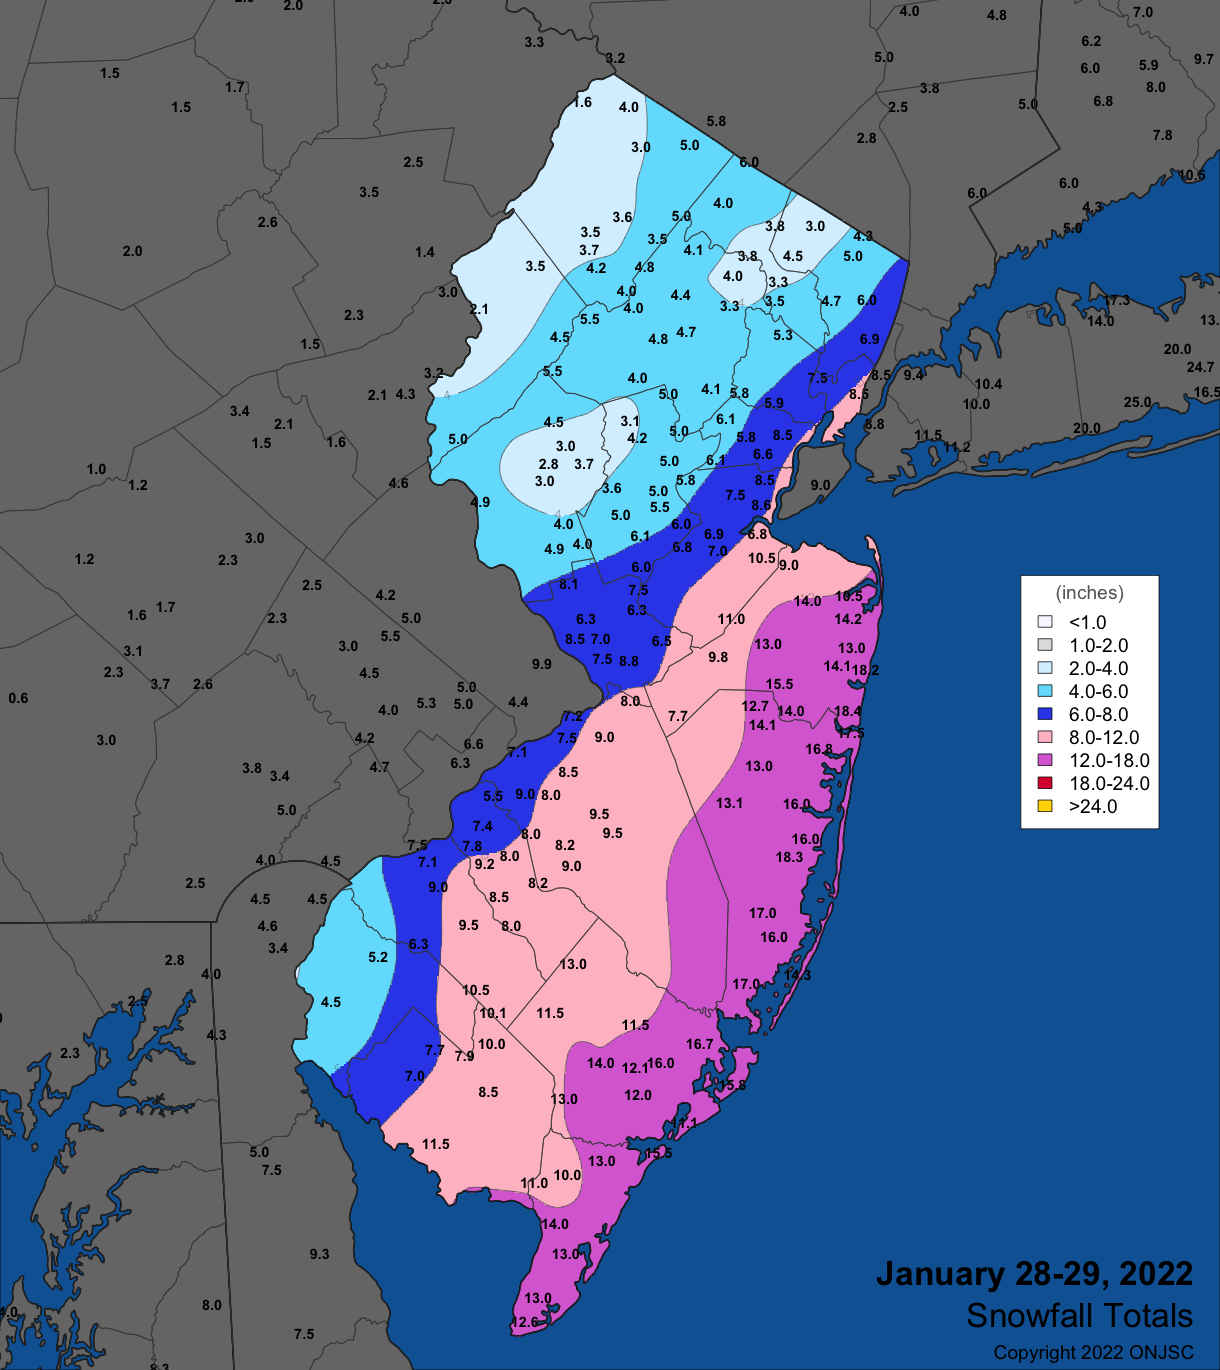
Figure 8. Snowfall on January 28th–29th. Observations are from CoCoRaHS, NWS Cooperative Observer, and NWS Trained Spotter reports.
| County | Location | Snowfall |
|---|---|---|
| Atlantic | Galloway Township | 17.5” |
| Bergen | North Arlington | 7.0” |
| Burlington | Southampton | 9.5” |
| Camden | Somerdale | 9.2” |
| Cape May | Ocean City | 15.5” |
| Cumberland | Newport | 11.5” |
| Essex | Maplewood | 5.9” |
| Gloucester | Franklin Township | 10.5” |
| Hudson | Hoboken | 8.5” |
| Hunterdon | Frenchtown & Ringoes | 4.9” |
| Mercer | Hamilton Square | 8.8” |
| Middlesex | Monroe Township | 11.0” |
| Monmouth | Manasquan | 18.4” |
| Morris | Chatham | 6.3” |
| Ocean | Lacey Township | 18.3” |
| Passaic | Hawthorne & Wayne | 4.5” |
| Salem | Woodstown | 5.2” |
| Somerset | Hillsborough Township | 6.1” |
| Sussex | Hardyston | 5.8” |
| Union | Elizabeth | 8.5” |
| Warren | Greenwich | 5.0” |
Table 2. Maximum snowfall for the 28th–29th storm in all NJ counties. Observations are from CoCoRaHS, NWS Cooperative Observer, and NWS Trained Spotter reports.
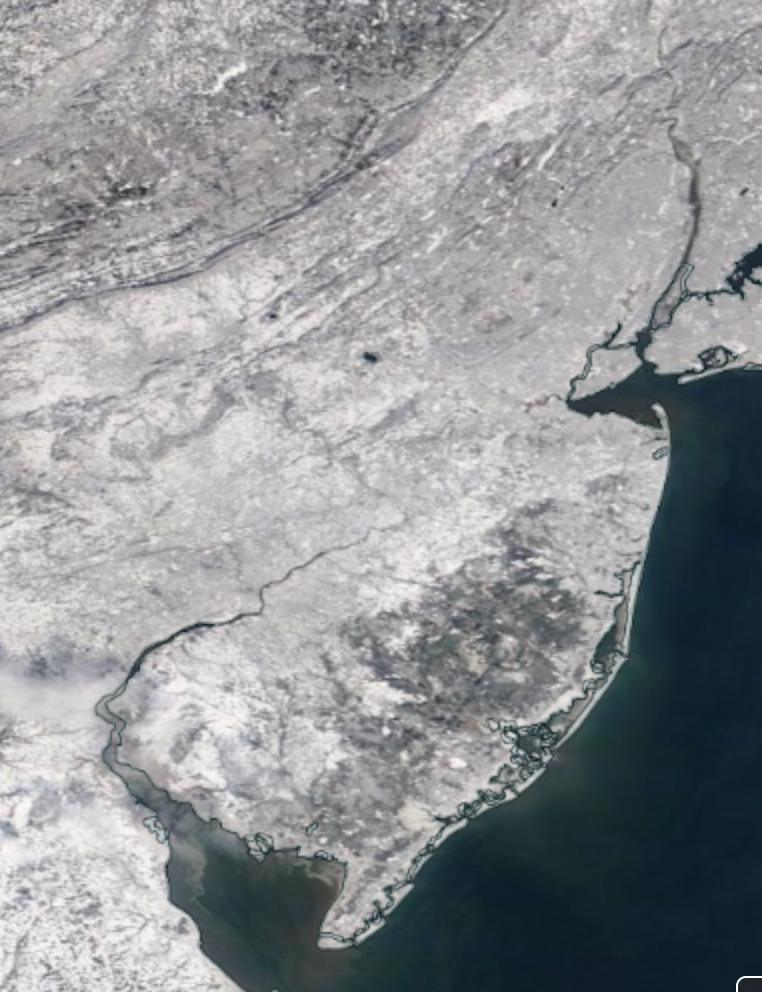
Figure 9. NASA MODIS visible satellite image showing snow cover across New Jersey and surrounding states on the morning of January 30th.
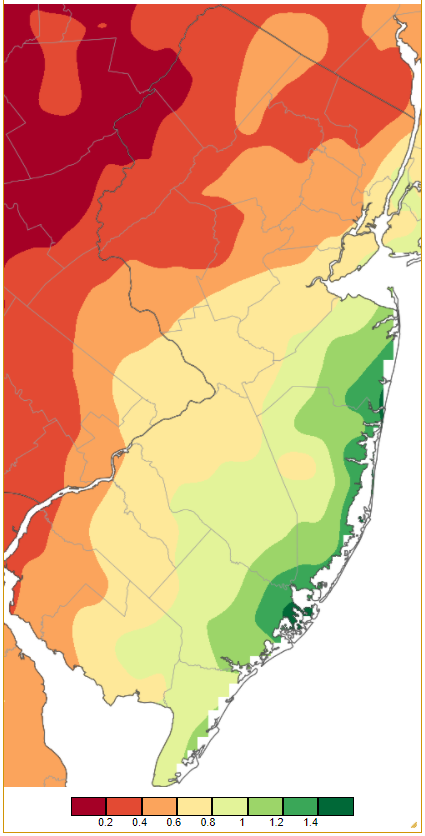
Figure 10. Precipitation across New Jersey from 7AM on January 28th through 7AM January 30th based on a PRISM (Oregon State University) analysis generated using generated using NWS Cooperative and CoCoRaHS observations. Note the scale in inches beneath the map.
The highest barometric pressure of January was reached on the 8th with readings from 30.60”–30.65”. The storm on the 17th saw the pressure fall to 29.05”–29.15”. Fascinating pressure fluctuations occurred around the world following the explosive eruption of the undersea Hunga Tonga-Hunga Ha’apai volcano within the nation of Tonga on January 15th (Tonga time, which is 16 hours ahead of Eastern Standard Time). New Jersey was no exception, and as seen in barometric pressure readings at New Brunswick (Middlesex), the initial pressure wave arrived at 10AM EST on the 15th, approximately 11 hours following the eruption (Figure 11). The pressure wave arrived in NJ a second time 14 hours later at midnight on the 15th.
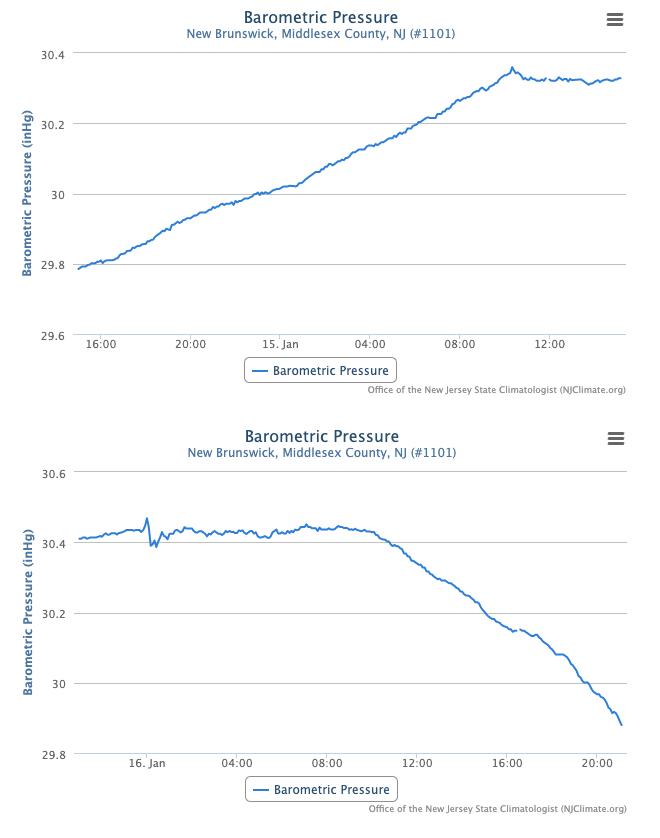
Figure 11. Surface air pressure (inches of mercury) from 3:15 PM EST January 14th to 3:15 PM January 15th (top) and 9:10 PM January 15th to 9:10 PM January 16th (bottom). The first pressure wave from the Tonga eruption is visible at 10:00 AM on the 15th and the second wave at midnight on the 15th.
As mentioned at the beginning of this report, wind gusts reached 40 mph or higher on 15 days, 13 of which were in the first 18 days of the month. Lower Alloways Creek Township (Salem) started things off with a 40 mph gust on the 1st. The highest elevation station in NJ at High Point Monument (HPM; Sussex) is commonly among the windiest locations, and did not disappoint on the 2nd with a gust to 42 mph. Winds at the coast gusted to 43 mph at Little Egg Harbor Township (Ocean) and 41 mph in Harvey Cedars (Ocean) on the 3rd. HPM reached 40 mph on the 6th and 52 mph on the 7th, when Fortescue (Cumberland) and Little Egg Harbor Township each hit 43 mph. HPM got to 49 mph on the 8th, Fortescue 41 mph on the 10th, and HPM 42 mph on the 11th. A five-day run of gusty weather commenced on the 14th with 50 mph at HPM and 42 mph at both Harvey Cedars and Atlantic City Marina (Atlantic). This was followed by 48 mph at HPM on the 15th, and 49 mph at Harvey Cedars, Seaside Heights (Ocean) 47 mph, Fortescue 45 mph, and four locations from 42–44 mph on the 16th. The storm on the 17th brought gusts reaching 50 mph in Sea Girt (Monmouth) and Harvey Cedars and 41–49 mph at 19 other NJWxNet locations. HPM hit 58 mph on the 18th when five stations gusted to 40–46 mph. The end-of-month snowstorm found coastal gusts of 51 mph in Little Egg Harbor Township, 46 mph at Harvey Cedars, 41–43 mph at four other locations, and a gust of 60 mph at HPM as the storm departed. HPM made it up to 48 mph and Harvey Cedars 41 mph on the 30th.
Temperature
There were 13 January days when high temperatures at one or more NJWxNet stations reached or exceeded 45°. Of the eight of these that reached at least 50°, the 2nd found Woodbine (Cape May) up to 66°, the monthly high, Cape May Court House (CMCH; Cape May) 63°, Atlantic City Marina 62°, and Vineland (Cumberland) 60° (Figure 12). The other 62 NJWxNet stations topped out from 50°–59°. This was also the mildest day of the month for minimums, with the coolest being 42° at Walpack (Sussex). Statewide, the 2nd was the mildest day of the month. CMCH reached 63°, 14 stations got to 62°, and 27 from 60°–61°. HPM had the lowest high at 47°. The 13th found ten stations up to 50° and 43 from 45°–49°. CMCH and Woodbine hit 50° on the 14th, when 46 locations reached 45°–49°.
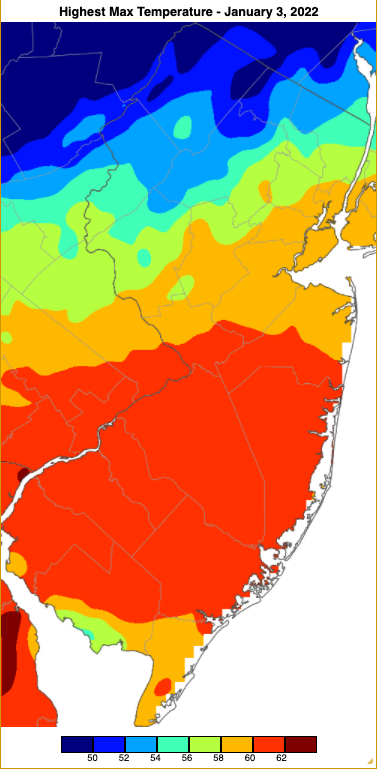
Figure 12. Maximum temperatures on January 2nd based on a PRISM (Oregon State University) analysis generated using NWS, NJWxNet, and other professional weather stations. Note the 2°F increment scale beneath the map.
NJ had a wide range of high temperatures on the 16th, with Fortescue at 51° and three locations 50°, while Vernon Township (Sussex) only rose to 21° and HPM 22°. Warmth was more widespread on the 17th when Fortescue, Greenwich (Cumberland), Mullica (Atlantic), and Vineland all hit 52° and 43 locations rose to 45°–51°. CMCH hit 54°, with 39 sites from 50°–53° and 21 stations from 45°-49° on the 19th. CMCH hit 50° with 33 others from 45°–49° on the 20th.
Daily minimum temperatures fell to 10° or lower on 20 days. Of these, 11 had at least one NJWxNet station bottoming out at 5° or colder. The first of these was on the 11th with Sandyston (Sussex) and HPM each down to 2°. HPM only made it up to 12° for a high on the 2nd, with Fortescue the “mildest” high at 28°. Walpack hit 3° on the 12th, with Sandyston and Pequest (Warren) at 5°. The first subzero lows of the season occurred on the 15th with HPM down to -4° and High Point (Sussex) -2°. Lows of 1°–10° were reached at 19 stations. HPM only got to 11° that afternoon with all NJWxNet station highs remaining below freezing. The air was exceedingly dry on the 15th as seen in a mid-morning map of dew point temperatures ranging from -15° at High Point and Pequest to -1° at Little Egg Harbor Township (Figure 13). Surface air temperatures at High Point, Walpack, and Sandyston all fell to -5° on the 16th, with six other sites from -4°–0°, and 47 NJWxNet stations from 1°–10°. Several stations warmed throughout the day and exhibited 40°–41° diurnal ranges.
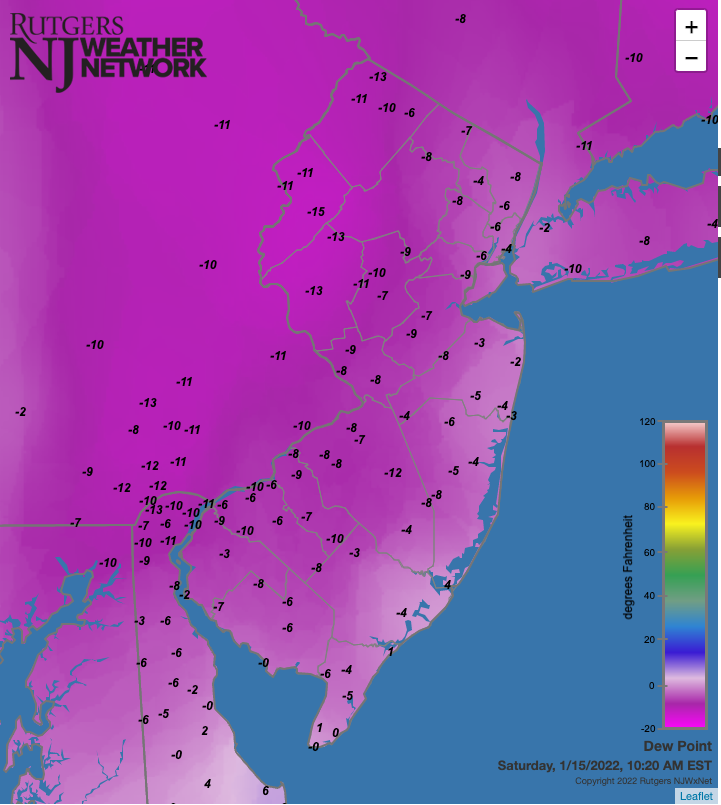
Figure 13. Dew point temperatures at 10:20 AM on January 15th from Rutgers NJ Weather Network, the Delaware Environmental Observing System network, and National Weather Service airport stations.
Vernon Township and HPM dropped to 2° on the 21st, another day when daily maximums remained below freezing throughout NJ. The coldest minimum of the month occurred on the 22nd when Sandyston dropped to -10°, followed by -9° at Walpack, High Point -6°, Vernon Township -3°, and 17 sites from 1°–10°. Harvey Cedars only fell to 21°, some 31 degrees milder than Sandyston. Sandyston reached -1° on the 26th with 12 locations from 1°–9°. Excessive cold continued on the 27th with Sandyston bottoming out at -8°, Walpack -7°, and 39 NJWxNet station from 0°–10°. There was a pronounced inversion that morning with Parsippany (Morris) only falling to 24° and coastal Harvey Cedars only fell to 22°. All of NJ remained below freezing on the 29th and 30th. The 29th found HPM down to 2° and Stewartsville (Warren) and High Point each at 3°. Walpack fell to -5° on the 30th, with Pequest at -2° and widespread 0°–10° minimums at 50 NJWxNet stations. While fewer stations were as cold on the 31st, the cold was more extreme in the north where Sandyston was -6°, Walpack -5°, Pequest -3°, Basking Ridge (Somerset) and Hopewell Township each -2°, Charlotteburg (Passaic) -1°, and 27 stations from 1°–10° (Figure 14).
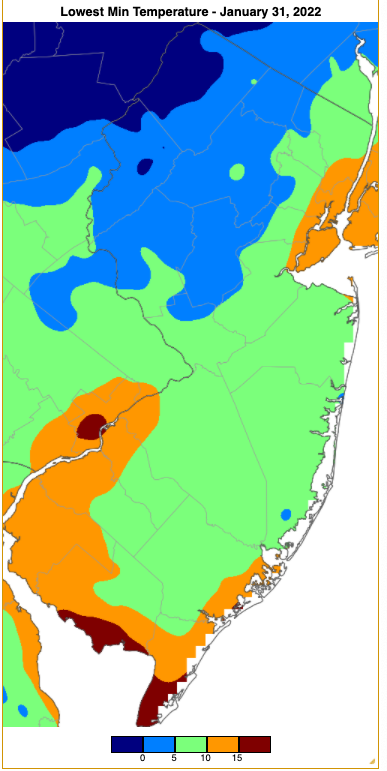
Figure 14. Minimum temperatures on January 31st based on a PRISM (Oregon State University) analysis generated using NWS, NJWxNet, and other professional weather stations. Note the in 5°F increment scale beneath the map.


