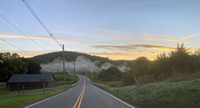
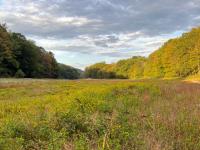
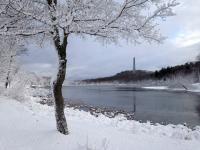
November Overview
Following a remarkably dry, record-breaking October, and the two driest consecutive months on record, you had to wonder if November would have anything of note to add to a rather peculiar fall. In short, it did not disappoint. Drought continued (but it precipitated!), warmth prevailed, and a November snowfall record was established for a single storm and location. More on fall 2024 will be presented below. First, a recap of November conditions.
Statewide, November precipitation (rain and melted snow) averaged 2.65”. This was 0.71” below the 1991–2020 normal and ranks as the 52nd driest November dating back 130 years to 1895. The extreme northwest was wettest and the extreme south driest (Figure 1). The northern climate division (Hunterdon-Somerset-Union counties and northward) averaged 2.89” (-0.58”, 50th driest), the southern division (Mercer-Middlesex-Monmouth southward, except along the coast) 2.51” (-0.78”, 51st driest), and the coastal division (mainly east of the Garden State Parkway) 2.41” (-0.93”, 49th driest).
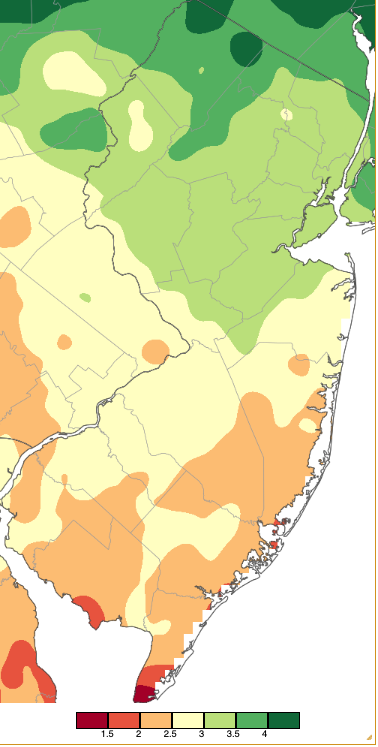
Figure 1. November 2024 precipitation across New Jersey based on a PRISM (Oregon State University) analysis generated using NWS Cooperative, CoCoRaHS, NJWxNet, and other professional weather station observations from approximately 8 AM on October 31st to 7 AM on November 30th. Note the scale in inches at the bottom of the map. Totals range from 1.00”–1.49” (dark red) to 4.00”–4.49” (dark green).
Statewide snowfall averaged 0.6”. This was 0.2” above normal and ranks 43rd snowiest of the past 130 Novembers. The northern snow division (Warren-Morris-Essex counties northward) averaged 2.2” (+1.3”, 34th snowiest). The central snow division (Hunterdon-Mercer-Somerset-Union-Middlesex-Monmouth) came in at 0.0” (-0.6”) and the southern snow division (Burlington-Ocean southward) also averaged 0.0” (-0.2”), each tied with many Novembers without measurable snowfall.
The statewide monthly average temperature of 49.1° was 4.0° above normal, ranking 5th mildest on record. Seven of the eight mildest Novembers in the past 130 years have occurred since 2001 (Table 1). The average high was 59.6°, which was 4.9° above normal and tied as the 4th mildest. The average low was 38.6°, which was 3.1° above normal and tied for 10th mildest. The north averaged 47.0° (+3.9°, 5th mildest), south 50.3° (+4.0°, tied for 4th mildest), and the coast 51.5° (+4.2°, tied for 3rd mildest).
| Rank | Year | Nov. Avg. Temp. |
|---|---|---|
| 1 | 2015 | 49.7° |
| 2 | 2006 | 49.6° |
| 3 | 2020 | 49.2° |
| 3 | 2009 | 49.2° |
| 5 | 2024 | 49.1° |
| 6 | 2011 | 48.9° |
| 6 | 1975 | 48.9° |
| 8 | 2001 | 48.8° |
| 9 | 1931 | 48.7° |
| 10 | 1999 | 48.6° |
| 10 | 1994 | 48.6° |
Table 1. The 11 mildest Novembers on record across New Jersey since 1895.
Precipitation, Storms, and Drought
Rain and melted snow amounted to as much as 5.05” for the month at Highland Lakes (Sussex County), leading the state in this department. Following this was 4.94” at High Point (Sussex), Sandyston (Sussex) 4.08”, Montague Township (Sussex) 3.99”, Mount Olive Township (Morris) 3.97”, Mount Arlington (Morris) 3.87”, and West Milford (Passaic) 3.83”. On the low end, West Cape May (Cape May) only saw 1.01”, followed by Lower Township (Cape May) with three stations at 1.26”, 1.39”, and 1.47”. Next came Fortescue (Cumberland) at 1.51”, Woodland Township (Burlington) 1.79”, Ocean City (Cape May) 1.81”, and Stafford Township (Ocean) 1.99”.
Many locations saw, at best, a trace of snowfall. However, in the north, at stations with a full complement of daily observations, monthly snowfall was topped by Vernon Township at 15.6”, Sparta (Sussex) 7.8”, Mount Arlington 6.5”, Randolph Township (Morris) 5.5”, and two Jefferson Township (Morris) totals of 5.4” and 5.3”.
Before getting to several precipitation events that occurred during the month, let’s begin with a discussion of drought conditions. The beginning of the month continued a record dry period that began in the last day or two of September and included a statewide average of 0.02” of precipitation in October, New Jersey’s driest month in the past 130 years. A number of locations failed to pick up any measurable precipitation in October, with this streak continuing through November 9th. Some gauges picked up a few hundredths of an inch over this period, but among those sites without measurable precipitation and lengthy records, streaks reached from 38 to 42 days before rain arrived statewide on the 10th (Table 2). Five locations with records back to the 19th century broke or tied previous precipitation-free streaks; for Philadelphia, PA, and New Brunswick (Middlesex), this was by 13 and 7 days, respectively.
| Location | Consecutive days without measurable precipitation | Records date back to |
Previous record and end date for run |
|---|---|---|---|
| Atlantic City Airport (Pomona) | 38 | 1943 | 34 (6/24/1949) |
| Atlantic City Marina | 39 (tie) | 1873 | 39 (9/15/1995) |
| Cape May | 38 | 1894 | 34 (11/19/2001) |
| Newark Airport | 41 | 1931 | 26 (6/24/1949) |
| New Brunswick | 41 | 1896 | 34 (11/11/1924) |
| Philadelphia | 42 | 1871 | 29 (11/8/1874) |
| Trenton | 42 | 1865 | 38 (5/23/1903) |
Table 2. Record periods without measurable precipitation achieved by early November at NWS stations with long-term records. All end dates for 2024 were November 9th except the 10th for New Brunswick.
With the release of the November 5th US Drought Monitor map, a region of Extreme Drought (D3) was introduced in New Jersey for the first time since October 15, 2002 (Figure 2). This included a portion of the south Jersey Pinelands extending eastward to the coast and covered 19.8% of NJ. The remainder of south Jersey was categorized as being in Severe Drought (D2). North Jersey was mostly in Moderate Drought (D1), however, a portion of the Highlands deteriorated to D2. All told, D2 covered 56.6% of NJ and D1 the remaining 23.6%. D1 has a recurrence interval of 5–10 years, D2 from 10–20 years, and D3 from 20–50 years.
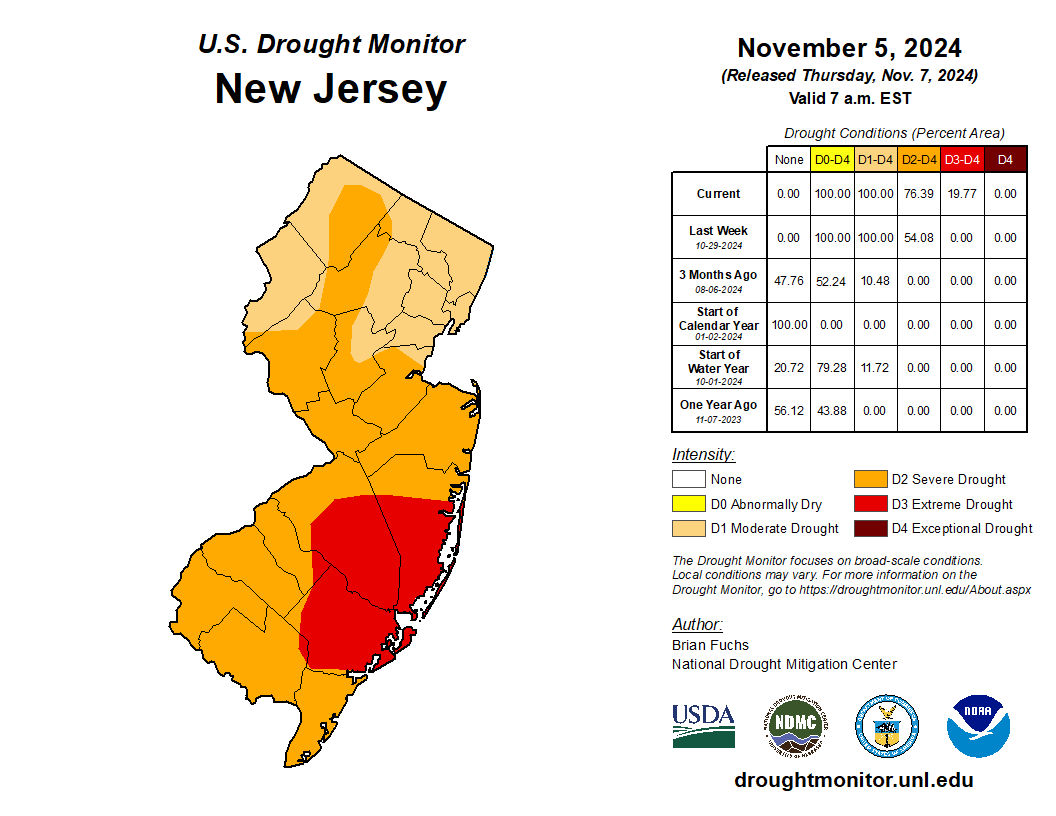
Figure 2. U.S. Drought Monitor map of conditions in NJ as of November 5, 2024.
With the increasing desiccation came early-November wildfires (Figure 3). The largest was the Jennings Creek fire that scorched over 5,000 acres split relatively equally in West Milford and across the border in New York. Tragically, one NY firefighter perished fighting this fire. On several days, smoke from this fire lofted over northeast NJ into New York City, impacting air quality. Overall, the more than 500 fires in NJ during October and the first half of November caused minimal structural damage.
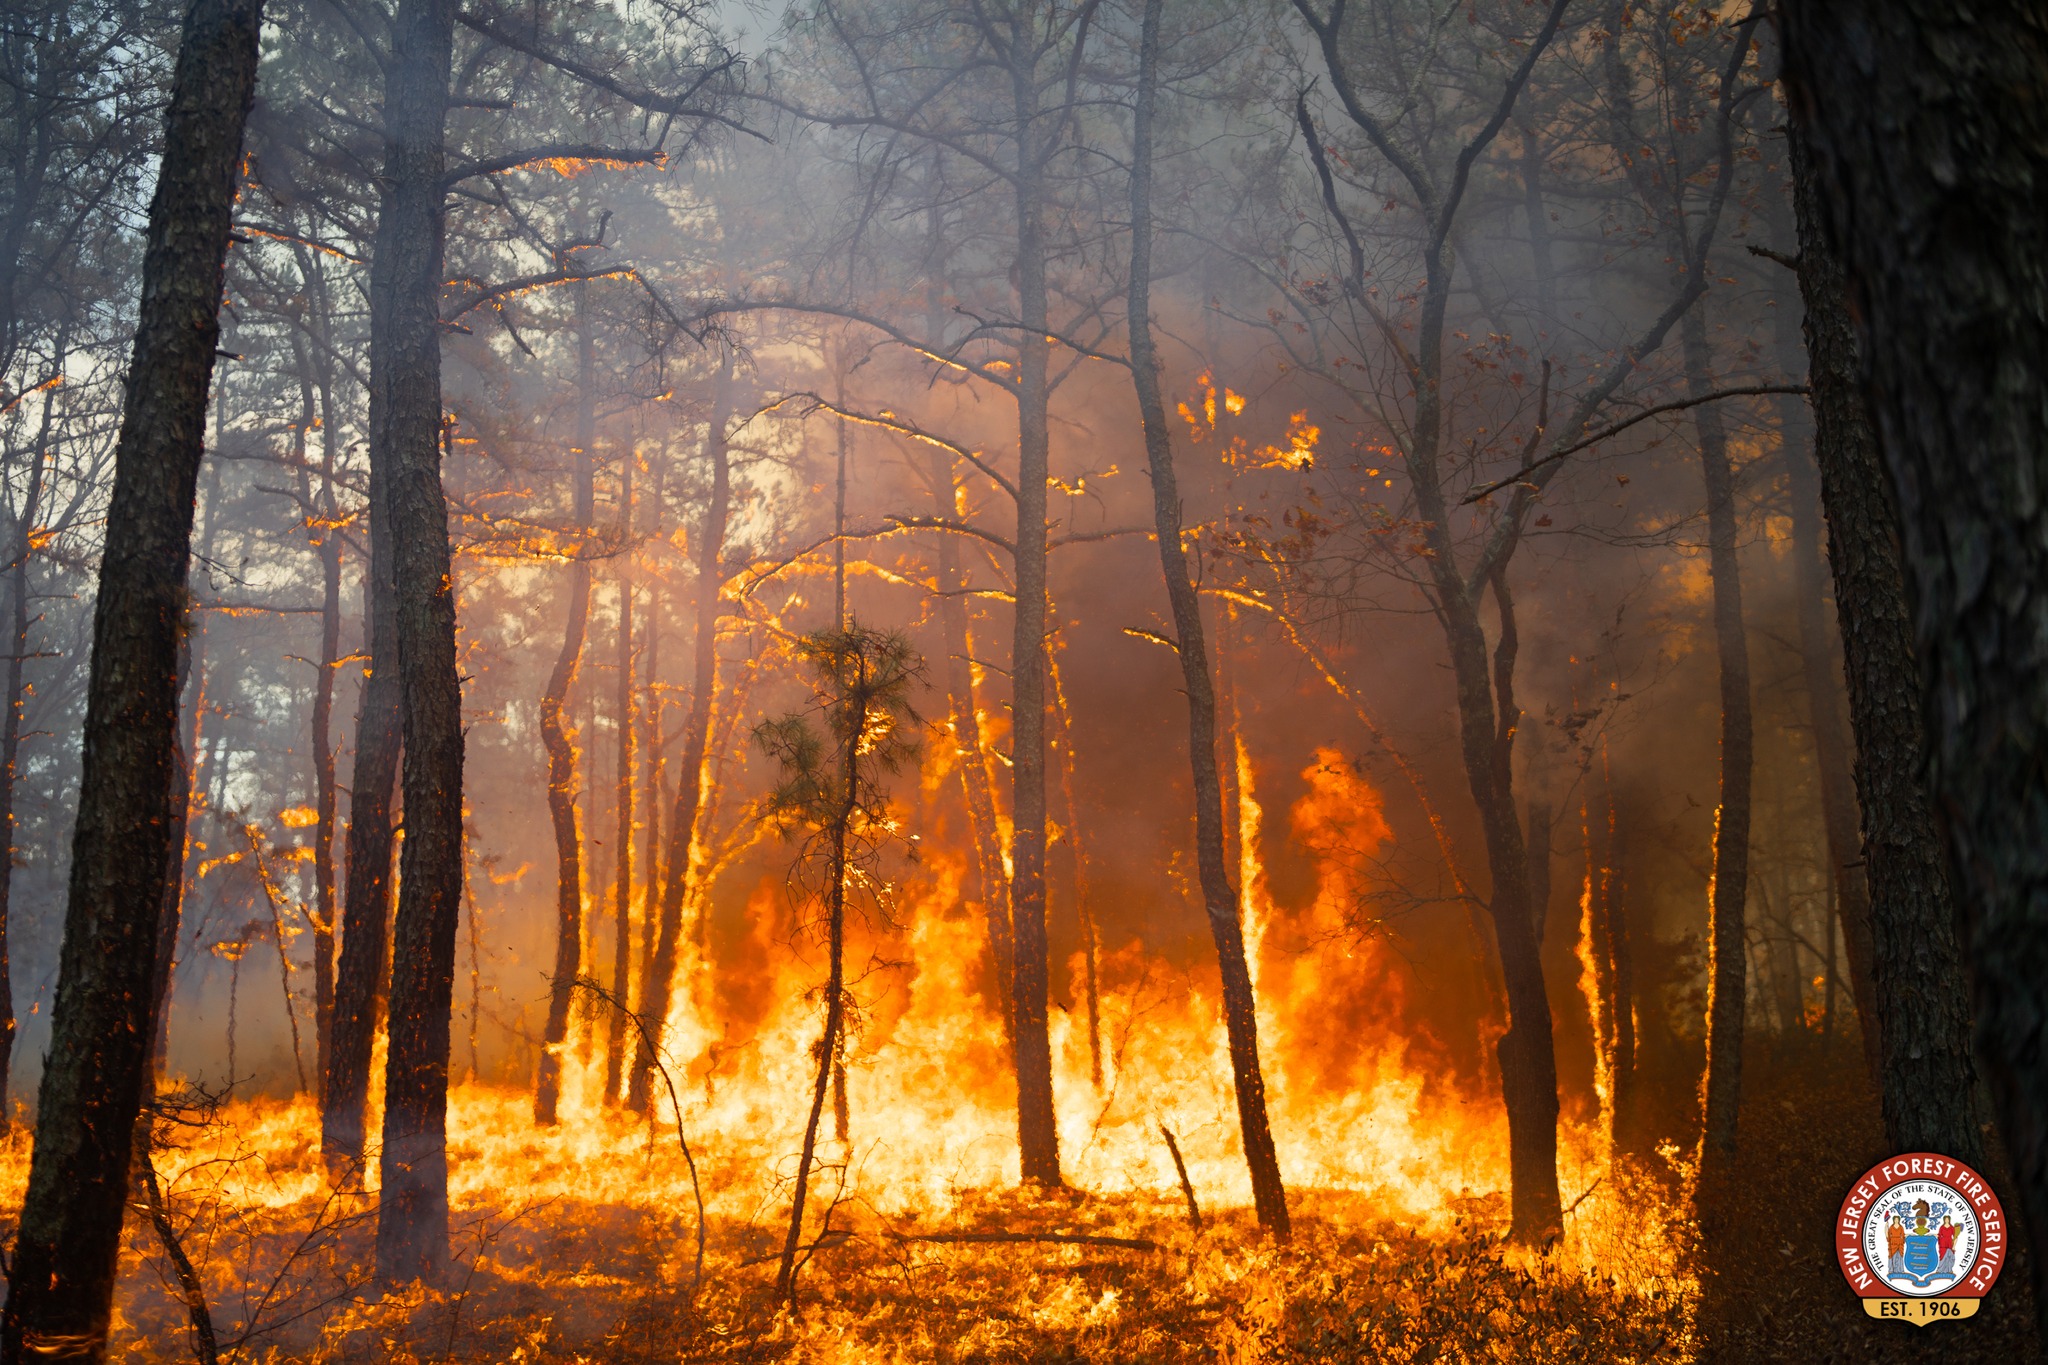
Figure 3. Bethany Run fire at the border of Burlington and Camden counties on November 7, 2024. It burned through 360 acres (courtesy of NJ Forest Fire Service).
Concerns regarding water resources led to a change on the 13th from a statewide Drought Watch to a Drought Warning. This provides the NJ Department of Environmental Protection with more authority regarding the management of water supplies. It does not involve mandatory water restrictions (though some individual communities and purveyors have suggested restrictions).
Ending the most extreme period of dry conditions, late-evening rain on the 10th into the pre-dawn hours of the 11th brought mainly light rain across most of the state (Figure 4). The far south received as much as 0.72” and 0.71” at two Woodbine (Cape May) stations and 0.67” at Dennis (Cape May). Of 291 Community Collaborative Rain, Hail, and Snow Network (CoCoRaHS) reports, six were from 0.50”–0.72”, 154 from 0.25”–0.49”, and 131 from 0.07”–0.24”.
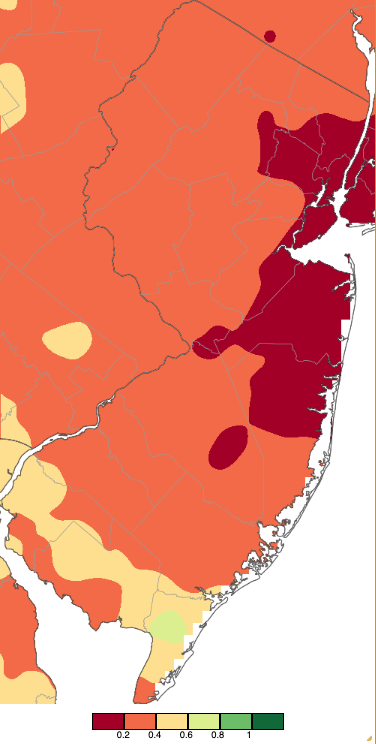
Figure 4. Precipitation across New Jersey from 7 AM on November 10th through 7 AM November 11th based on a PRISM (Oregon State University) analysis generated using NWS Cooperative, CoCoRaHS, NJWxNet, and other professional weather station observations. Note the scale in inches beneath the map.
It was not until late on the 20th that the first substantial precipitation in almost two months arrived in NJ. Thunderstorms accompanied the rain early on the 21st. Light rain and drizzle continued during the day before rain intensity picked up in the evening and overnight into the 22nd. In north Jersey, rain turned to snow, whitening the ground with a dusting to an inch or two at some lower-elevation locations. With increasing altitude, the snowfall amounts exploded, with a measurement of 20.0” recorded at the base of High Point Monument (Sussex; elevation 1,803 feet). The daytime hours on the 22nd saw rainfall of varied intensity before ending in the predawn hours of the 23rd.
Precipitation (rain and melted snow) from this lengthy event totaled 3.86” at Vernon Township, High Point 3.50”, Mount Olive Township 2.85”, Mount Arlington 2.84”, and Montague Township 2.72”. Of 300 CoCoRaHS observations 124 were from 2.00”–2.97” and 163 from 1.00”–1.99” (Figure 5). Three Lower Township stations reported the least precipitation with 0.66”, 0.67”, and 0.70”. This quelled the fire danger and moistened soils around the state, though little went into runoff and replenishing reservoir levels or soaked deeply into the ground to replenish aquifers.
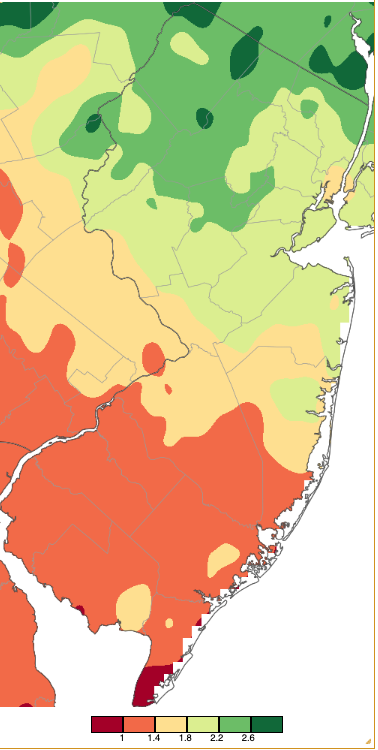
Figure 5. Precipitation across New Jersey from 7 AM on November 20th through 7 AM November 23rd based on a PRISM (Oregon State University) analysis generated using NWS Cooperative, CoCoRaHS, NJWxNet, and other professional weather station observations.
The 20.0” of snow at the Monument is the largest NJ total ever observed in November. While not an official observation, given that the site is not a standard observing location, it none the less exceeds the previous greatest official November storm total of 17.5” at Dover (Morris) in November 1938. The earlier storm was the state’s largest November snow event on record, leaving a foot or more at locations in the north in Morris, Passaic, Sussex, and Warren counties, and in the south in Atlantic and Gloucester counties. The storm this month also deposited 16.0” at the High Point Ranger Station at the entrance of the park on Route 23 (1,500 feet elevation). A location at 950 feet in Wantage (Sussex) saw 5.9”, while the nearby valleys around 400 feet above sea level saw a slushy inch or two. Elsewhere in Sussex County, Highlands Lakes (1,363 feet) received 15.7”. Six counties saw measurable snow from this event (Figure 6, Table 3). The snow remained at higher elevations for days after the event, joining other high-elevation locations in southern NY and northeastern PA (Figure 7).
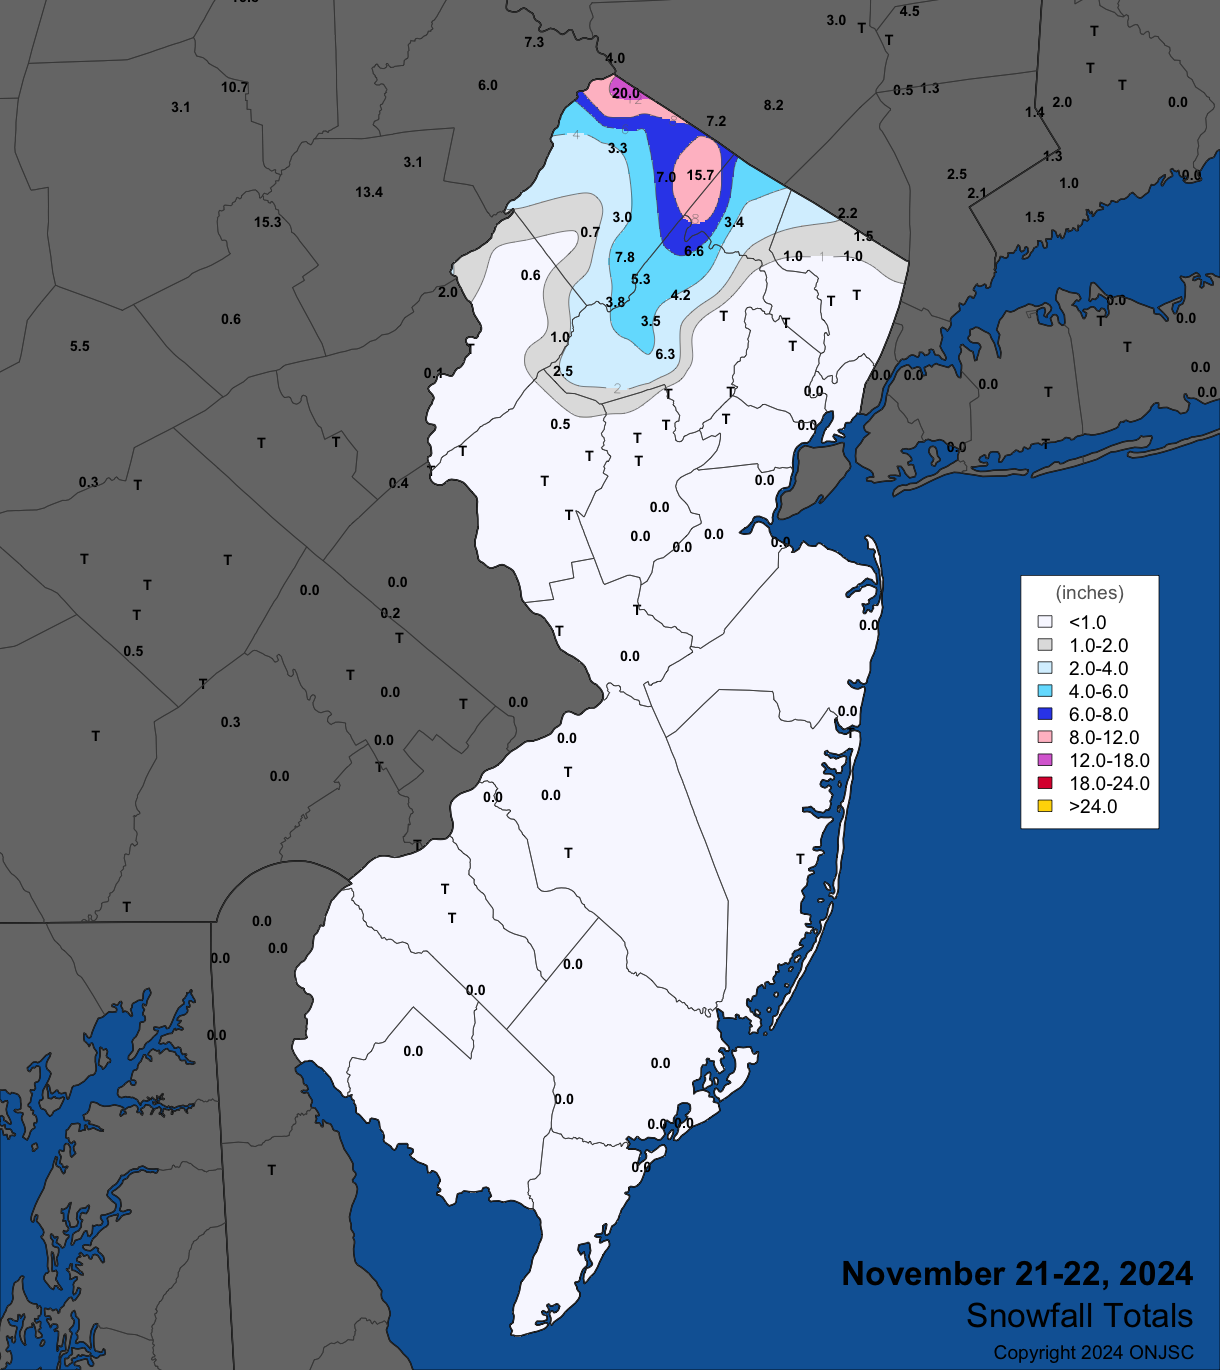
Figure 6. Snowfall from the evening of November 21st through the morning of November 22nd. Observations are from CoCoRaHS, NWS Cooperative Observer, and NWS Spotter reports.
| County | Location | Snowfall |
|---|---|---|
| Bergen | Montvale | 1.5” |
| Hunterdon | Lebanon | 0.5” |
| Morris | Green Pond | 6.6” |
| Passaic | West Milford Township | 3.4” |
| Sussex | High Point Monument | 20.0” |
| Warren | Hackettstown | 1.0” |
Table 3. Maximum snowfall for the November 21st to November 22nd storm in counties where measurable snow fell. Observations are from CoCoRaHS and NWS Spotter reports.
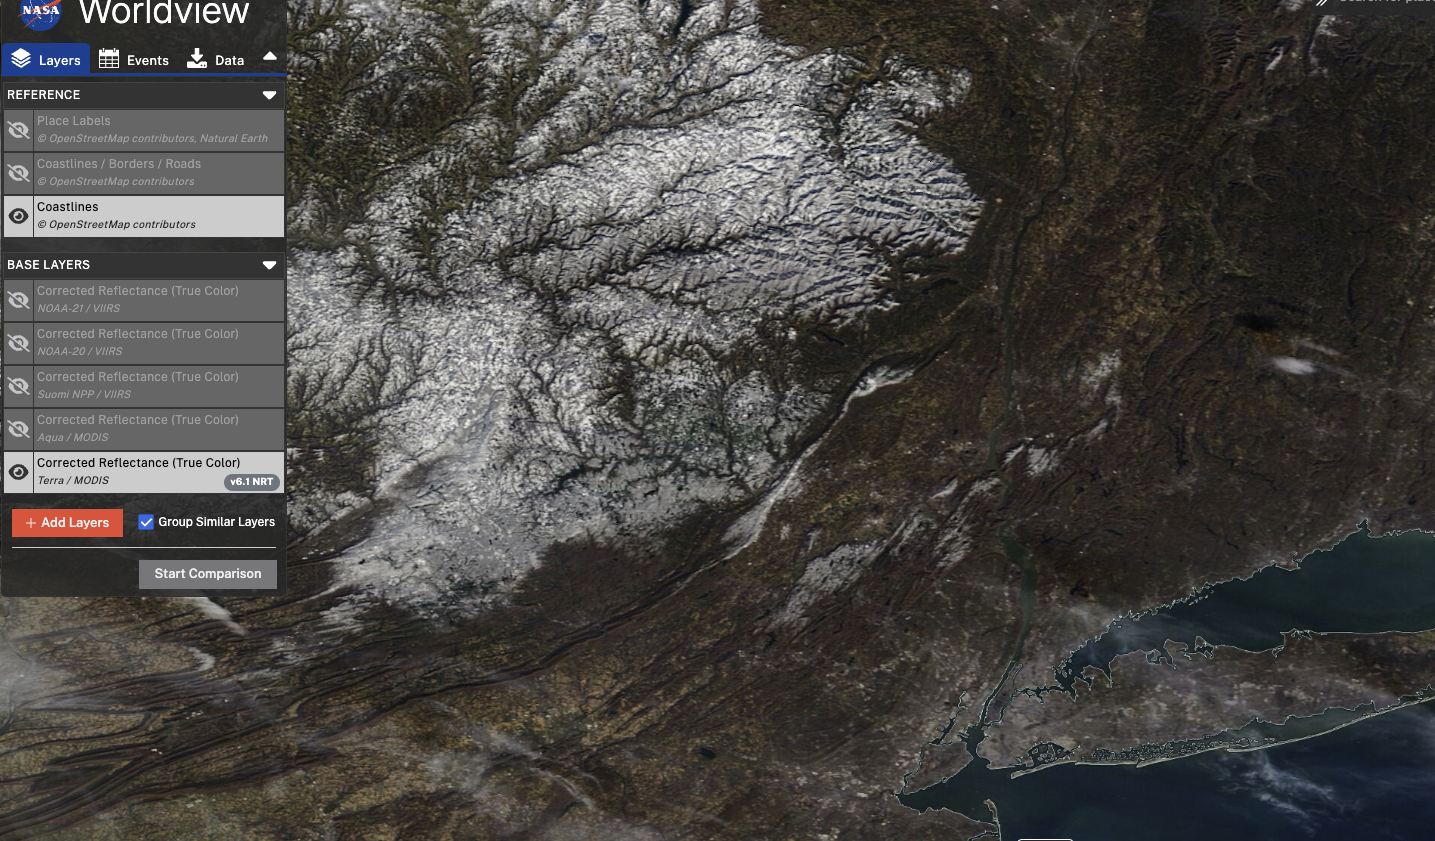
Figure 7. NASA MODIS visible image of northern NJ, southeast NY and northeast PA on the morning of November 25th showing remaining snow cover over the northern NJ Highlands and Kittatinny Ridge, southeast NY hills, the Poconos, and Catskills during the first day with clear skies following the 21st–22nd snowfall.
A small event on the morning of the 26th brought as much as 0.41” of rain to Montague Township, Mount Ephraim (Camden) 0.33”, Mount Laurel Township (Burlington) 0.32”, and Wayne Township (Passaic) 0.32”.
The final precipitation event of November began during the predawn hours of the 28th, lasting into the early afternoon. While the additional rainfall (with less than an inch of snow at elevations above 1,400 feet) was beneficial, coming on Thanksgiving, the timing could have been better. Statewide, most locations received from 0.50” and 1.00” (Figure 8). Two stations in Cranford Township (Union) caught 1.27” and 1.12”. Also, West Windsor Township (Mercer) came in with 1.10”, Westfield (Union) 1.06”, Vineland (Cumberland) 1.03”, and in Hudson County, Harrison and Kearny both saw 1.01”. Of the 250 CoCoRaHS observations, eight were from 1.00”–1.27” and 220 were from 0.50”–0.99”.
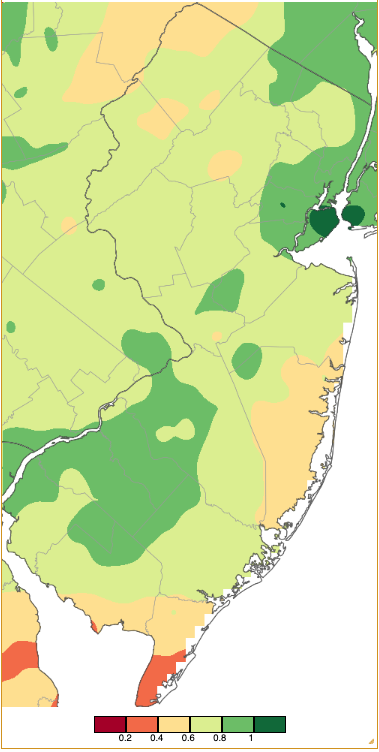
Figure 8. Precipitation across New Jersey from 7 AM on November 27th through 7 AM November 29th based on a PRISM (Oregon State University) analysis generated using NWS Cooperative, CoCoRaHS, NJWxNet, and other professional weather station observations.
While welcome, the rains and snows of late November did little to minimize drought conditions that had expanded by mid-month such that 50.2% of the state was categorized as D3 and 49.8% as D2. This remained constant on the November 19th and 26th maps (Figure 9). Considerably more precipitation is needed to cut into deficits that grew since late summer to exceed 10”. Not that the entire deficit has to be eliminated in order to climb out of the drought, but deficits can only decline when a month’s precipitation exceeds the long-term average.
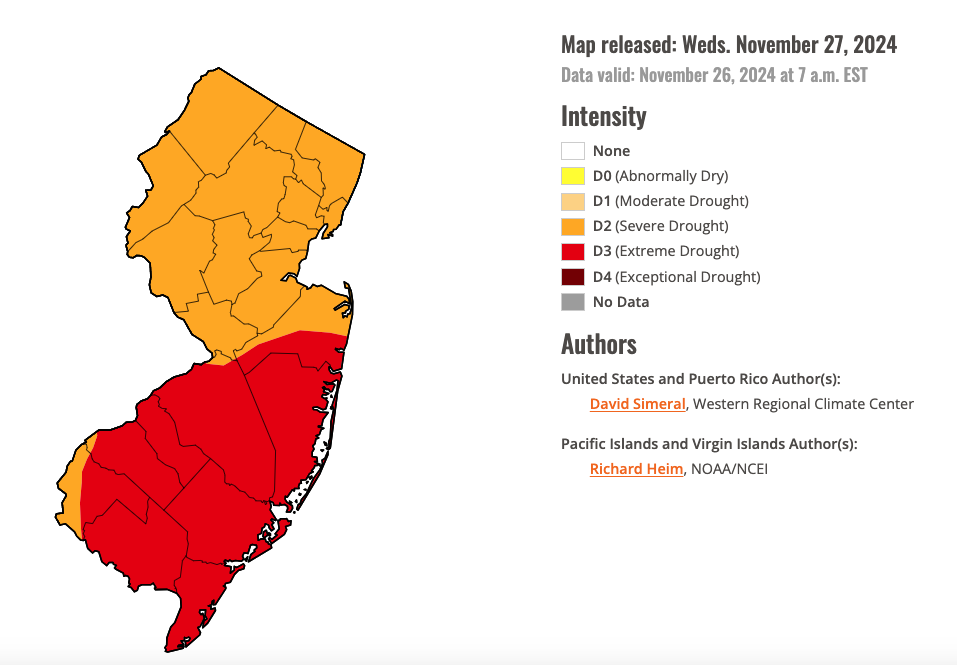
Figure 9. U.S. Drought Monitor map of conditions in NJ as of November 26, 2024.
The highest atmospheric pressure of the month was observed on the 4th at 30.45”–30.55”. The lowest pressure came on the 22nd at 29.20”–29.40”. Winds on the 1st gusted to 40 mph at Wantage. Vernon topped out at 47 mph on the 9th, with Vernon at 48 mph and High Point Monument 46 mph on the 12th. The 15th saw gusts to 46 mph at Wantage and 41 mph at High Point Monument, the 16th found the Monument and Wantage each at 42 mph, and Wantage to 41 mph on the 17th. The storm from the 20th–23rd first brought gusts to 43 mph at Lower Alloways Creek Township (Salem) on the 20th. The month’s windiest day was the 21st with Fortescue to 47 mph, Atlantic City Marina (Atlantic) 45 mph, and 41 mph at both West Cape May and Lower Alloways Creek Township. The last 40+ mph gusts of the month were on the 23rd at Sea Girt (Monmouth) 43 mph, Seaside Heights (Ocean) 41 mph, and High Point Monument 40 mph.
Temperature
The first week of November was exceptionally mild, with highs reaching 80° at some spots on three days. On the 1st, 10 Rutgers NJ Weather Network (NJWxNet) stations reached 81° and 24 hit 80°. 35 stations were from 70°–79°. Fortescue was coolest of the 69 NJWxNet stations at 70°. Mannington (Salem) and West Deptford (Gloucester) rose to 78° on the 5th with 58 stations from 70°–78°. The 6th saw Hammonton (Atlantic), Piney Hollow (Gloucester), and Sicklerville (Camden) up to 84°, 47 sites from 80°–83°, and 18 from 70°–79° (Figure 10). Harvey Cedars (Ocean) was coolest at 69°. The New Brunswick NWS Cooperative station reached 82°, which was the warmest temperature so late in the season at this location with records back to 1896. This also tied for the warmest November temperature. Warmth continued on the 7th with Cape May Court House (Cape May) up to 82°, eight stations at 80° or 81°, and 55 from 70°–79°. Hammonton, Mannington, and Red Lion (Burlington) made it to 72° on the 8th.
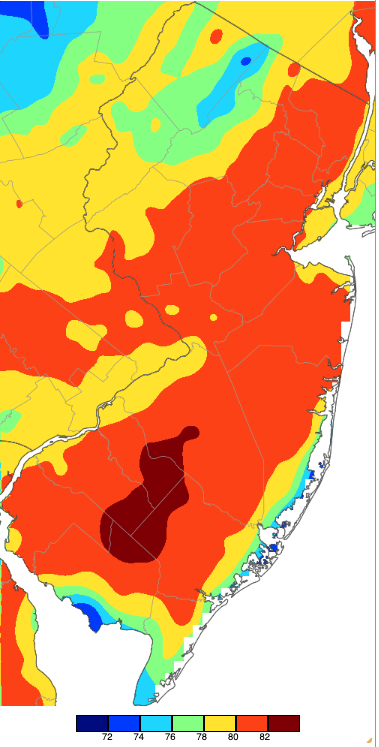
Figure 10. Maximum temperatures on November 6th based on a PRISM (Oregon State University) analysis generated using NWS, NJWxNet, and other professional weather stations. Note the 2° scale beneath the map.
The first of two remaining days of the month with highs of 70° was the 11th with 75° reached at Cherry Hill (Camden), Red Lion, and Toms River (Ocean) and 70°–74° at 38 locations. The 18th found Mansfield (Burlington) at 70°, with no other station beating that mark.
There were 13 November days with lows of 25° or colder at one or more NJWxNet station. This began on the 3rd with Walpack (Sussex) at 22°. Walpack dropped to 24° on the 4th, while Harvey Cedars was warmest with a low of 53°. Hopewell Township (Mercer) and Walpack reached 25° on the 9th, and Walpack was 21° on the 10th and 25° on the 12th. Walpack was first into the teens on the 13th at 18° with 51 stations from 21°–32°. Walpack was 17°, Pequest (Warren) 19°, and 47 sites from 20°–32° on the 14th. At 46°, Seaside Heights, Point Pleasant, and Sea Girt had lows 29° milder than Walpack.
Walpack fell to 24° on the 17th and 19th, and 25° on the 25th. Walpack and Hopewell Township dropped to 24° on the 27th, with 39 sites from 25°–32°. Hopewell Township was 25° on the 29th and 37 stations ranged from 26°–32°, including Pennsauken (Camden) recording its first freezing low of the season. The 30th was by far the coldest day of the month. High Point Monument and Walpack both fell to 18° and the 67 other NJWxNet stations were from 19° to 31°. This was the first day with all NJWxNet stations below freezing. For nine stations, it was their first freeze. This includes Atlantic City Marina, Harvey Cedars, Little Egg Harbor Township (Ocean), Lower Alloways Creek Township, Lyndhurst (Bergen), Point Pleasant, Sea Girt, and Seaside Heights where their freeze occurred near dawn. So, too, for the first time this season did the urban NWS Newark Liberty International Airport (Union) station. It took until 9:55 PM on the 30th for Fortescue to fall to freezing.
The 30th freeze ended New Jersey’s growing season (Figure 11), which first ended locally at Walpack at 6:45 AM on October 10th. The longest duration between freezes this season was 250 days at Atlantic City Marina (March 25th–November 29th), while Walpack had a 165-day season (April 28th–October 9th), a difference of 85 days between the interior valley and coastal stations.
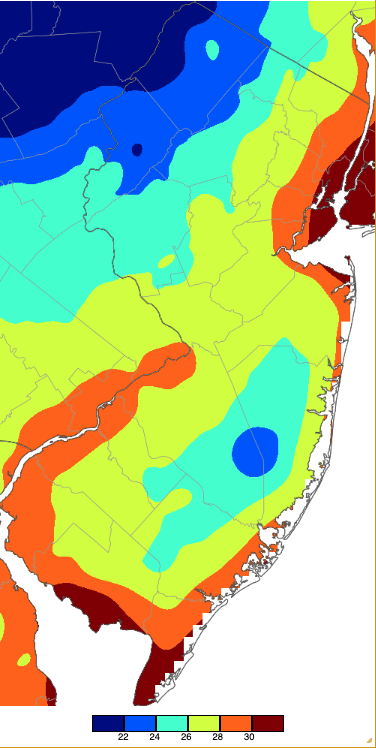
Figure 11. Minimum temperatures on November 30th based on a PRISM (Oregon State University) analysis generated using NWS, NJWxNet, and other professional weather stations.
Fall 2024 Overview
This was New Jersey’s driest and fourth warmest fall of the past 130 years. Thus, much like November, it fits this report’s theme of “peculiar.” Precipitation, or the lack thereof, was the headline issue. Statewide, fall precipitation averaged 3.45”. This was 8.26” below the 1991–2020 average. It is interesting that nine decades (in increments back to 1900–1909) are represented in the top ten driest falls (Table 4).
| Rank | Year | Fall Avg. Precip. |
|---|---|---|
| 1 | 2024 | 3.45" |
| 2 | 1922 | 4.24" |
| 3 | 1914 | 4.54" |
| 4 | 2001 | 4.86" |
| 5 | 1941 | 4.96" |
| 6 | 1931 | 5.45" |
| 7 | 1908 | 5.65" |
| 8 | 1998 | 5.98" |
| 9 | 1965 | 6.08" |
| 10 | 1916 | 6.13" |
Table 4. The 10 driest falls on record across New Jersey since 1895.
South Jersey received the least, witness the worst drought conditions there as depicted above in Figure 9. Of course, northern areas were exceptionally dry too (Figure 12). September was NJ’s third driest on record while October was the driest of any month. The September–October total was the lowest of any two-month interval. October–November precipitation was the fourth lowest for that interval. Looking back further, the June–November (summer/fall) interval was the 5th driest on record at 15.91” (-9.38”).
The least-dry locations this fall were in the northwest and northern coast, including Highland Lakes (Sussex) 7.30”, Wall Township (Monmouth) 5.68”, Neptune City (Monmouth) 5.62”, Neptune Township (Monmouth) and Montague Township (Sussex) each 5.52”, Mine Hill Township (Morris) 5.46”, and West Milford (Passaic) 5.43”. Driest spots were in the south and included Lower Township (Cape May) 2.30” and 2.44” (two locations), Ocean City (Cape May) 2.33”, Monroe Township (Gloucester) 2.45”, Hammonton (Atlantic) 2.48”, Winslow Township (Camden) 2.61”, and Franklin Township (Gloucester) 2.65”. The NWS Atlantic City Marina Coop station (Atlantic) caught 2.19” for a record-dry fall, easily surpassing the previous record 2.89” in 1941. This was also the driest of any 3-month period. Records there extend back to 1874.
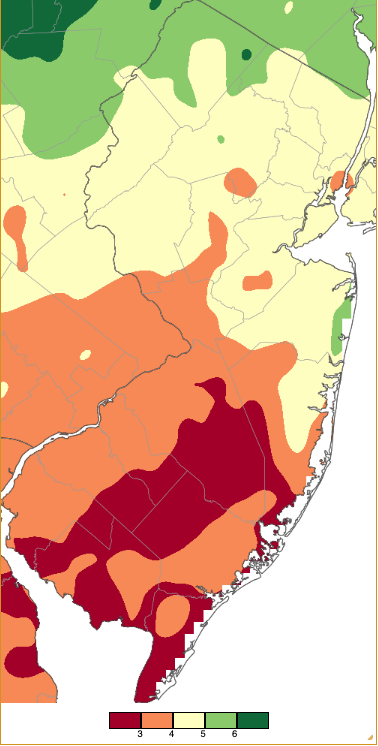
Figure 12. Fall 2024 precipitation across New Jersey from 8AM on August 31st through 7AM November 30th based on a PRISM (Oregon State University) analysis generated using generated using NWS Cooperative and CoCoRaHS observations.
As a result of this aridity, reservoir and ground water levels plummeted, leading to the early-November declaration of a NJ Drought Warning. Parched fields and forests erupted in flame over 500 times, challenging overtaxed firefighters. Come late November, a persistent ridge of high pressure that generated the drought conditions, likely enhanced by our warming climate, weakened and rain and even snow arrived to reduce the fire danger. Whether this will signal a major pattern shift that will subsequently replenish our water supplies this winter remains to be seen.
Fall temperatures across the state averaged 57.9°. This was 2.1° above normal, and as noted above, tied with 2011 and 2007 as the 4th warmest on record (Table 5). All but the warmest in 1931 have occurred since 2005. The first eleven months of 2024 have averaged 57.6°. This is 2.6° above the 1991–2020 mean and ranks as the warmest January–November period back to 1895. Of the 1,548 running 12-month periods since January–December 1895, the December 2023 to November 2024 interval ranks as the 9th warmest. It is certain that 2024 will either rank as New Jersey’s warmest or second warmest calendar year on record.
| Rank | Year | Fall Avg. Temp. |
|---|---|---|
| 1 | 1931 | 58.5° |
| 2 | 2015 | 58.3° |
| 3 | 2005 | 58.0° |
| 4 | 2024 | 57.9° |
| 4 | 2011 | 57.9° |
| 4 | 2007 | 57.9° |
| 7 | 2021 | 57.8° |
| 8 | 2016 | 57.7° |
| 8 | 2020 | 57.7° |
| 8 | 2017 | 57.7° |
Table 5. The 10 mildest falls on record across New Jersey since 1895.
The highest temperatures reached across the state during the season are mapped in Figure 13. The lowest temperatures, almost all occurring on November 30th, are shown in Figure 14.
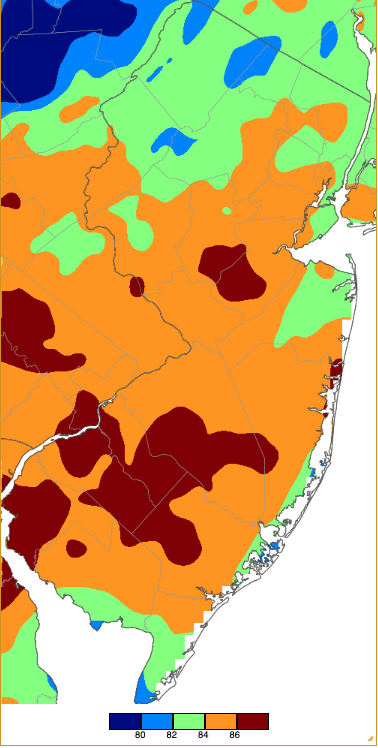
Figure 13. Extreme maximum temperatures during fall 2024 (September 1st–November 30th) based on a PRISM (Oregon State University) analysis generated using NWS, NJWxNet, and other professional weather stations. The seasonal maximum occurred on different days at different locations.
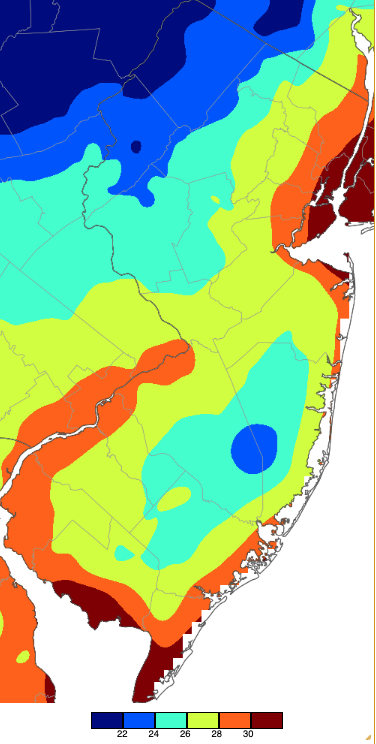
Figure 14. Extreme minimum temperatures during fall 2024 (September 1st–November 30th) based on a PRISM (Oregon State University) analysis generated using NWS, NJWxNet, and other professional weather stations. The seasonal minimum occurred on different days at different locations.


