NJ State Climatologist Dave Robinson contributed to this report.
Roughly every two to seven years, a joint ocean – atmosphere phenomenon known as “El Niño” occurs. Right now happens to be one of those times and this event is showing every indication of being one of the three strongest El Niños of the past 65 years. An El Niño is defined as the prolonged warming of sea surface temperatures (SST) over the central and eastern equatorial Pacific and associated anomalies of atmospheric variables such as winds, clouds, and precipitation. According to the National Oceanic and Atmospheric Administration (NOAA), to be categorized as an El Niño, a 3-month SST anomaly of at least 0.9°F (0.5°C) above average must be observed in the central and eastern equatorial Pacific for five consecutive 3-month periods. There are related atmospheric anomalies elsewhere around the globe that are associated with conditions in the tropical Pacific. Do these anomalies extend to New Jersey, especially during a strong event? This article discusses the current El Niño episode as of mid-December and speculates as to whether NJ is already being impacted by this event and may continue to be into spring 2016.
The Pacific temperature anomaly is associated with a relaxing of normally persistent east-to-west flowing trade winds across the equatorial Pacific. In a non-El Niño year, these winds push warm water to the western Pacific Ocean, leading to an upwelling of cooler, nutrient-rich water in the eastern sector. This leads to more clouds and rain in the west and clear skies and low precipitation totals in the east. As a result, deserts, such as the Atacama, are found on the west coast of South America.
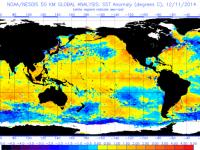
During an El Niño year anomalously warm water is found toward the central and eastern equatorial Pacific. This is just the case at this time (Figure 1). As the current event peaks, it will be interesting to see if the weeks and months ahead will exhibit weather anomalies similar to past El Niños. This would include the western portion of South America being unusually wet, and parts of Central America experiencing above-average rainfall. Signs of El Niño influences have already been recognized. For instance, the 2015 hurricane season in the central and eastern Pacific was unusually strong, while the season was quite weak in the Atlantic basin. This was in part due to atmospheric wind shear shifting from the tropical Pacific across the Atlantic, hindering the vertical development of storms there, while shear was weaker than average in the Pacific.

Figure 1. Sea surface temperature anomalies on December 17, 2015.
Beyond the reduced threat of tropical systems making landfall, the United States feels the effects of an El Niño in other ways (Figure 2). Whether we have yet to see these impacts in 2015 is somewhat uncertain. Recent heavy rain in the central states was in part the result of an active subtropical jet stream coming out of the tropics and into the south-central states. This is not uncommon in El Niño years, nor is the excessive warmth in much of the eastern two thirds of the nation experienced in recent weeks. However, these episodes are not exclusive to such years. Also, the heavy rain and snow in the Northwest is atypical of an El Niño winter. Nor has Florida yet been too wet and has not been cooler than average, as is common during these winters. Yet it is still early, and El Niño impacts are generally more strongly felt throughout the winter. Perhaps there is a late start to these influences, and maybe they are aligning themselves further east than normal. And of course El Niño isn’t the only influence on day-to-day or seasonal conditions in the US and elsewhere. Should typical conditions unfold, the greatest El Niño impacts will be in the northern tier states experiencing drier and warmer than average conditions, the Southern tier states seeing wetter and cooler conditions, the Northwest drier than average, and the Southwest potentially, but not assuredly, wetter than normal. This possible scenario is seen in the 3-month temperature and precipitation outlooks just released by the NWS Climate Prediction Center (Figure 3).

Figure 2. General weather pattern across North America during an El Niño winter (credit: NOAA).

Figure 3. 3-month (Jan. – Mar.) outlook for the U.S. produced by NWS CPC. The patterns are very similar to the winter (Dec. – Feb.) outlook released in November.
So what might be in store for New Jersey this 2015/16 El Niño winter? Typically, during such years, NJ experiences above-average temperatures and above-average precipitation. This does not mean that the winter will be a bust for snow. We have seen over the years that no two El Niño years are alike. This is evident in our analysis of the seven strongest El Niños since 1950. There have been years where NJ had above average snow, precipitation, and temperatures, and others where the state received a mere few inches of snowfall with below-average precipitation and temperatures. The El Niño with the largest positive winter temperature departure was the 1997-1998, the strongest of the six (Figure 4). The other six winters were split evenly between above- and below-normal temperatures, with some leaning toward the warm side. Falls were mainly below average, while this past fall was the state’s 5th warmest in the past 121 years (2.6° above average). Springs lean toward the cool side.

Figure 4. NJ statewide seasonal temperature departures for the seven strongest El Niños since 1950. The summer and fall observations are within the year leading to the late-year event peak and the winter and spring that follow.
Regarding precipitation behavior, four out of the seven strongest El Niños featured above-average precipitation in New Jersey from November through April (Figure 5). Seasonally (Figure 6), falls tend to be drier than average (fall 2015 precipitation was 1.42” below average). Four of seven winters were drier than average while the three above average were comparatively wetter than the dry ones. Spring precipitation leans somewhat above average, with 1983 being exceptionally wet.

Figure 5. NJ statewide November – April precipitation departures for the seven strongest El Niños since 1950. The November – December observations are within the year leading to the late-year event peak and the January – April observations from the months that follow.

Figure 6. NJ statewide seasonal precipitation departures for the seven strongest El Niños since 1950. The summer and fall observations are within the year leading to the late-year event peak and the winter and spring that follow.
NJ snowfall is the third variable of interest during the course of an El Niño event. Much as has been noted with temperature and precipitation, there is no clear signal based on past strong El Niño snow seasons (taken here as covering the entire interval from first to last flake). One season (1957/58) stands out with significantly above-average snowfall. On the other hand, two seasons (1972/73 and 1997/98) were among the least snowy of any since 1895. Another, (1982/83) was generally a benign snow season, with the exception of a severe storm on February 11 that deposited more than half of the season’s snowfall. This is an excellent example of the impact one weather event can have on a seasonal signal, indicating that, especially for snowfall, it is difficult to make credible seasonal projections.
In summary, it is reasonable to conclude that while strong El Niños bring rather predictable departures in temperature and precipitation from the tropical Pacific to various locations around the United States, there is no strong New Jersey signal. While NJ cool season temperatures and precipitation tend to average above normal and snowfall below average, there are no strong leanings. Perhaps if there were observations available from dozens of strong El Niños there would be a clearer signal, or at least it would be known more definitively that such a signal could not be found. However, at this point it is best to say that while strong El Niños appear to have some impact on NJ weather, the state sits in the middle latitudes where other influences are also felt. Such things as the position, stability, and strength of the polar jet stream and associated high and low pressure systems in the middle and high latitudes may alter or even overwhelm El Niño influences. These are monitored through such indices as the North Atlantic Oscillation, the Arctic Oscillation, and the Pacific–North American teleconnection pattern. In the years ahead, we may have a better idea of how and why these wide-ranging phenomena from equatorial to polar regions interact and influence each other from season to season and from year to year. This especially when a region as influential as the tropical Pacific exhibits exceptionally anomalous behavior. Until such time, we will be left with a bit of a mystery as to what may unfold in the weather department as we approach each season here in New Jersey.


