Overview
October was the second mildest on record in the Garden State since records commenced in 1895. This follows on the heels of the 11th warmest September, leaving most residents wondering when cool weather would arrive and leaves would turn and fall. For the first time since at least 1900, not a single weather observing station in New Jersey recorded a freezing low temperature on any day in either September or, as is climatologically most common, October. All of this resulted in a leaf season that was delayed by one to two weeks.
The statewide average October temperature of 61.1° was 5.7° above the 1991–2020 normal, a mark only surpassed in 2007 (Table 1). The average daily maximum of 70.1° (+4.3°) ranked 5th mildest (tied with 1920), and the average minimum of 52.0° (+7.1°) tied with 2007 as the mildest. These temperatures are close to what Norfolk, Virginia, normally experiences in October. In fact, despite the mean temperature normally declining 11.5° from September to October, this year’s mean was warmer than four previous Septembers since 1895 and the minimum was milder than 14 earlier Septembers. The state’s three climate divisions all ranked second mildest, with the north at 59.0° (+5.7°), south 62.3° (+5.8°), and coastal 63.2° (+5.6°).
| Rank | Year | Oct. Avg. Temp |
|---|---|---|
| 1 | 2007 | 62.1° |
| 2 | 2021 | 61.1° |
| 3 | 2017 | 60.4° |
| 4 | 1971 | 59.8° |
| 5 | 1947 | 59.2° |
| 6 | 1990 | 58.7° |
| 6 | 1984 | 58.7° |
| 6 | 1949 | 58.7° |
| 9 | 2019 | 58.2° |
| 10 | 1919 | 58.1° |
Table 1. The ten warmest Octobers across NJ since 1895.
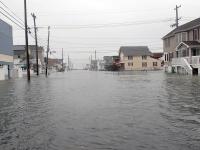
What had been a rather calm and dry October turned anything but that in the last week of the month when a soaking nor’easter impacted inland rivers, and a subsequent storm heading northward along the Appalachians brought more rain and persistent coastal flooding, including impacts up the tidal Delaware River. As a result, the statewide monthly rainfall of 5.18” was 0.99” above normal and ranked as the 24th wettest October of the past 127 years. The north was wettest at 6.16” (+1.71”, rank 17th wettest), followed by the south at 4.64” (+0.61”, rank 32nd wettest), and the coast with 4.08” (-0.01”, 40th wettest; Figure 1).

Figure 1. October 2021 precipitation across New Jersey based on a PRISM (Oregon State University) analysis generated using NWS Cooperative and CoCoRaHS observations from 7 AM on September 30th to 7 AM on October 31st. Note the scale in inches at the bottom of the map. Totals range from 2.00”–3.00” (dark red) to 7.00”–8.00” (dark green).
Precipitation and Storms
The wettest NJ locations in October were found in the Highlands. Topped by 9.12” in Warren (Somerset County), Rockaway (Morris) was next at 8.86”, then Randolph Township (Morris) 8.49”, Vernon Township (Sussex) 8.40”, West Milford (Passaic) 8.32”, and two Little Falls (Passaic) stations with 8.14” and 8.15”. The far south was driest with Woodbine (Cape May) only catching 1.82”, followed by Lower Township (Cape May) 2.50”, Weymouth Township (Atlantic) 2.54”, Wildwood Crest (Cape May) 2.57”, Maurice River Township (Cumberland) 2.68”, and Linwood (Atlantic) 2.77”.
The first precipitation event of the month was focused on the northwest from late on the 3rd into the early 4th. Mt. Olive (Morris) received 0.71” and Hackettstown 0.70”, with no other location over 0.50”. Rain resumed in north and central counties during the afternoon of the 4th before becoming heavy in southern areas during the overnight hours. Two Egg Harbor City (Atlantic) stations caught 1.96” and 1.66”, Port Republic (Atlantic) 1.83”, Riverton (Burlington) 1.75”, and Washington Township (Burlington) 1.58” (Figure 2).

Figure 2. Precipitation across New Jersey from 7 AM on October 4th through 7 AM on October 5th based on a PRISM (Oregon State University) analysis generated using NWS Cooperative and CoCoRaHS observations. Note the scale in inches beneath the map.
While onshore flow persisted from the 8th to 11th, it did not bring more than some drizzle and light showers with it until late in the period. As an example of the persistent easterly winds, each of the 65 hours from 6 AM on the 9th through 10 PM on the 11th, Harvey Cedars (Ocean) saw a wind gust of 23 mph or higher, with 48 hours gusting between 30–41 mph (a portion of this period is shown in Figure 3). This resulted in minor coastal flooding, as seen at the Barnegat Bay gauge at the Barnegat Lighthouse (Ocean) recording seven consecutive high tides in the “minor flood” range. Showers arrived early on the 10th but only brought as much as 0.49” to Woodbridge (Middlesex) and 0.48” to Maurice River Township. The central coast received more meaningful rain on the morning of the 11th, with Toms River (Ocean) catching 1.38”, two Pine Beach (Ocean) stations each with 1.20”, and Lakewood (Ocean) 1.07”. Less than 0.50” fell outside of this area.

Figure 3. Average hourly wind speeds and peak hourly wind gusts at the Harvey Cedars NJWxNet station from 6:00 AM on October 10th to 6:00 AM on October 11th.
A cold front shot through the region during the afternoon of the 16th. The thermal aspects of the passage will be covered later. Precipitation-wise, the immediate front was accompanied by just a burst of rain, with the bulk of the rain following within a few hours in steady form that lasted through the evening. Vernon Township received 0.79”, Hardyston (Sussex) 0.77”, and Franklin (Sussex) and Jefferson Township (Morris) each had 0.74”, with the rest of the state under 0.50”. Winds gusted to 49 mph in Columbus (Burlington) and 47 mph in Lower Alloways Creek Township (LACT; Salem).
Pleasant weather prevailed from the 17th–25th, with winds gusting on the 18th to 41 mph at High Point Monument (HPM; Sussex) and 40 mph at LACT. With the onset of a major nor’easter on the 25th, the bubble burst on a generally mild dry month. The storm began with a period of convective activity during the evening. Locally heavy rain fell in the storms, especially in northern and central areas, with pea-size hail observed in Franklin Township (Somerset) and winds gusting to 46 mph in LACT and 40 mph at Fortescue (Cumberland). These two Delaware Bay locations each had 44 mph gusts on the 26th, however, the main action was to the north, where a month’s worth of rain accumulated over the entire period of the complex storm, some falling into the pre-dawn hours of the 27th (Figure 4). Top totals were 6.63” in Warren and 5.95” at Rockaway, eight counties had at least one station catch between 5.00”–5.82”, four counties from 4.00”–4.99”, four from 2.00”–2.87”, and three from 1.49”–1.93” (Table 2).
The multiple-hour distribution of the heaviest rain kept flash flooding to a minimum, but ultimately led streams and rivers to experience “action” and “minor” flood levels within the Delaware, Passaic, and Raritan basins, along with some other north and central Jersey streams and rivers outside of these basins. Some of the gauges experiencing minor flooding included Tock Island (Warren) on the Delaware, Blackwells Mills (Somerset) on the Millstone, and Bound Brook (Somerset) on the Raritan. The antecedent dry conditions in the weeks since Ida and in many of the wettest area totals “only” approximately half of those of Ida kept river crests much lower than in early September.

Figure 4. October 25th–27th rainfall in NJ and surrounding states based on observations from Rutgers NJ Weather Network, NJ CoCoRaHS, National Weather Service Cooperative stations, and observations from several other networks. Over 350 NJ observations were used to generate the map. Not all observations that went into the colored contouring in NJ are shown to avoid overlapping values.
| County | Location | Rainfall |
|---|---|---|
| Atlantic | Pomona (AC Airport) | 2.59” |
| Bergen | North Arlington | 5.79” |
| Burlington | Medford | 2.87” |
| Camden | Haddon Heights | 1.93” |
| Cape May | Ocean City | 1.87” |
| Cumberland | Deerfield Township | 2.01” |
| Essex | Cedar Grove | 5.57” |
| Gloucester | Sewell | 2.00” |
| Hudson | Kearny | 4.84” |
| Hunterdon | Wertsville | 4.61” |
| Mercer | Princeton | 4.01” |
| Middlesex | Middlesex | 5.50” |
| Monmouth | Holmdel | 5.38” |
| Morris | Rockaway | 5.95” |
| Ocean | Berkeley Township | 4.07” |
| Passaic | Little Falls | 5.82” |
| Salem | Woodstown | 1.49” |
| Somerset | Warren | 6.63” |
| Sussex | Vernon Township | 5.42” |
| Union | New Providence | 5.00” |
| Warren | Oxford Township | 5.34” |
Table 2. The heaviest rainfall observed from October 25th-27th in all NJ counties based on observations from Rutgers NJ Weather Network, NJ CoCoRaHS, National Weather Service Cooperative stations, and observations from several other networks. A full listing of rainfall totals can be viewed here.
Quite close on the heels of the nor’easter, a storm moved from the lower Plains up through the Appalachians west of New Jersey. This resulted in less rainfall than forecast but brought strong southerly winds into the region that contributed to an extended period of Atlantic coastal flooding, which extended into Delaware Bay and the tidal portion of the Delaware River. The rain began on the 29th with morning showers in the south, followed by heavier rain moving up the Delaware Valley and briefly elsewhere during the afternoon and evening, prior to tapering off before dawn on the 30th. Phillipsburg (Warren) received the most with 1.87”, followed by Greenwich Township (Warren) at 1.79”, Holland Township (Hunterdon) 1.77”, 1.67” and 1.71” at two Frenchtown (Hunterdon) locations, White Township (Warren) 1.67”, 27 CoCoRaHS stations from 1.00”–1.46”, and 140 stations from 0.50”–0.99” (Figure 5).
Winds on the evening of the 29th were, at times, tropical storm force (at least 39 mph) along the Atlantic and Delaware Bay coasts. Gusts reached 69 mph in Tuckerton (Ocean), Seaside Heights 66 mph and 55 mph (two stations), Harvey Cedars 62 mph, Ocean City (Cape May) 62 mph, Barnegat Lighthouse 60 mph, Sea Girt 56 mph, and Berkeley Township 51 mph. In addition, 17 NJWxNet stations gusted from 40–49 mph. Maximum gusts on the 29th at NJWxNet stations are shown in Figure 6. As the storm dissipated on the 30th, HPM had a 41-mph gust. The departing nor’easter to the east and the new storm from the south contributed to the coastal flooding. For instance, beginning midday on the 27th and lasting until the morning of the 31st, the Barnegat Bay tide gauge at the Barnegat Lighthouse had eight consecutive high tides reach minor flood stage. Up the Delaware River, the Burlington (Burlington) gauge had nine high tides between the evening of the 27th and evening of November 1st reach moderate (2), minor (4), or close to minor (3) levels. This likely was a combination of the southerly winds pushing the tides up the river along with ample water from the nor’easter and the 29th storm flowing down river.

Figure 5. Rainfall from approximately 7 AM on October 29th to 7 AM on October 30th based on a PRISM (Oregon State University) analysis generated using NWS Cooperative and CoCoRaHS observations. Note the scale in inches beneath the map.

Figure 6. Maximum wind gusts at NJWxNet locations on October 29th.
A period of showers early on the 31st completed the monthly rainfall tally. The central and northern coast received the most, with 0.74” in Toms River, 0.72” at Wall (Monmouth), and 0.67” in Red Bank (Monmouth).
The highest barometric pressure readings of the month were in the 30.35”–30.40” range on the 6th. The lowest were in the 29.30”–29.40” range, associated with the nor’easter on the 26th. All days with 40 mph or greater wind gusts have been mentioned previously.
Temperature
There were eight October days when high temperatures at one or more NJWxNet station reached or exceeded 80°. As one might expect in a seasonal transition month, most occurred in the first half of the month. The 3rd saw LACT, Mannington (Salem), and Vineland (Cumberland) climb to a monthly maximum of 85°, with 37 other NJWxNet stations from 80°–84°. The 4th found four stations up to 84° and 31 from 80°–83°. Clouds and rain kept the highs much lower in the northwest, with Wantage (Sussex) only making it to 61°. LACT made it to 80° on the 7th, while six sites reached 81° and 13 hit 80° on the 7th.
A mid-month warm up found five stations at 81° and ten at 80° on the 14th, with the coolest station in the state, HPM, only 10° cooler. The 15th saw the most stations in a day this month top 80°. Mannington, Red Lion (Burlington), Sicklerville (Camden), and West Deptford (Gloucester) led the pack at 84°, with 43 stations from 80°–83° (Figure 8). Coastal Harvey Cedars was coolest at 73°. Mannington again hit 84° on the 16th, followed by 83° in Greenwich (Cumberland), and 29 stations from 80°–82°. Late-month 80° readings occurred at Berkeley Township and Mannington on the 25th.

Figure 7. Maximum temperatures on October 15th based on a PRISM (Oregon State University) analysis generated using NWS, NJWxNet, and other professional weather stations. Note the 2 °F increment scale beneath the map.
The three-day warm spell from the 14th–16th ended in a somewhat dramatic manner late in the afternoon of the 16th with the arrival of a cold front that saw temperatures plummet by as much as 20° in less than a half hour. This resulted in large differences between adjoining counties, as shown in Figure 8 where, for instance, Kingwood and Pittstown in Hunterdon County were down to 60° at 4:15 PM while just to the east in Somerset County, Hillsborough-Duke sat at 80°. The warmth to the east didn’t last much longer as by 4:30 Hillsborough-Duke was down to 71° and at 62° by 4:50. Figure 9 shows this downward plunge along with the gusty wind that accompanied the front and a sharp rise in barometric pressure. The top gust of 35 mph occurred between 4:25–4:30, with pressure rising from 29.57” at 4:15 to 29.66” at 4:40. Just 0.02” of rain fell with the frontal passage between 4:40 and 4:50, though later that evening, post-frontal rain of 0.45” accumulated. The dew point temperature fell 8° during the frontal passage before climbing just a bit as the evening rain began to fall.

Figure 8. Temperatures across the region at 4:15 PM on October 16th based on data from NJWxNet, NWS, and DEOS weather stations.

Figure 9. Timelines of temperature and dew point (top), wind speed and wind gusts (middle), and barometric pressure (bottom) at the Hillsborough-Duke NJWxNet station from 6:40 AM on October 16th to 6:40 AM on October 17th.
Nine October days found some NJWxNet stations dropping into the 30°s. Little did one suspect that the 35° minimum on the 1st at Sandyston (Sussex) would be just 2° above any other low recorded within the NJWxNet during the remainder of the month. Four other stations were 38° or 39° that morning, with eight other days in the month seeing lows in the 30°s. The next was the 2nd with Sandyston at 37° and Pequest (Warren) 39°. It wasn’t until two days following the warm spell breaking front on the 16th that lows again fell into the 30°s, with Walpack (Sussex) at 35°, Sandyston 36°, and five locations either 38° or 39° on the 18th.
The 19th found Hopewell Township (Mercer) down to 33°, Walpack and Pequest 34°, and 17 stations from 35°–39°. The lows around the state that morning exemplified a common pattern during the cooler portion of the year, with the coldest locations in the northwest and urban and warmth girding the eastern, southern, and southwestern coasts (Figure 10). Walpack reached 38° and Sandyston 39° on the 20th. Sandyston and HPM were 38° on the 23rd. The 24th brought a 33° low to Basking Ridge (Somerset), 34° at Hopewell Township and Kingwood, and 17 stations from 35°–39°. The last 30°s of the month were on the 28th with Sandyston at 35° and seven stations either 38° or 39°, and the 29th with the higher elevation sites of HPM and Vernon Township at 36° and five sites from 37°–39°.

Figure 10. Minimum temperatures on October 19th based on a PRISM (Oregon State University) analysis generated using NWS, NJWxNet, and other professional weather stations. Note the in 2 °F increment scale beneath the map.


