Overview
Wow, what a month. July 2021 provided a never-ending cascade of weather events, including a tropical storm, a record-tying number of tornadoes, large hail, flash floods, hot days, chilly nights, smoke-filled skies, and on the last day of the month, perhaps the nicest day of the summer. The statewide average precipitation of 7.59” was 2.88” above the 1991–2020 normal and ranked 8th wettest of all Julys back to 1895 (Table 1). It was the wettest July since 1975 and second wettest in almost 50 years. The northern portion of the state averaged 8.16” which was 3.44” above normal. The south averaged 7.36” which was 2.62” above normal.
| Rank | Year | July Avg. Precip. |
|---|---|---|
| 1 | 1897 | 11.37" |
| 2 | 1969 | 9.34" |
| 3 | 1938 | 8.93" |
| 4 | 1945 | 8.90" |
| 5 | 1975 | 8.71" |
| 6 | 1919 | 8.57" |
| 7 | 1925 | 7.68" |
| 8 | 2021 | 7.59" |
| 9 | 2004 | 7.52" |
| 10 | 1960 | 7.42" |
Table 1. The ten wettest Julys across NJ since 1895.
The average temperature of 75.8° was 0.4° above the 1991–2020 normal, but 1.9° above the 1895–2021 average. This ranked as the 24th warmest July since 1895. 13 of the 25 warmest Julys in the past 127 years have occurred since 2002. The nine July tornadoes is the most in a month since official records began in 1950. Tropical Storm Elsa was the earliest fifth storm of any season on record in the Atlantic basin. Read on for details on this potpourri of weather happenings.
Precipitation and Storms
More than an inch of rain fell at one or more NJ CoCoRaHS or NJWxNet location on 13 July days. On one of these days a station received more than 6”, three days had sites with as much as 4.00”–5.00”, four days saw locations with up to 3.00”–4.00”, two peaked at 2.00”–3.00”, and three at 1.00”–2.00”. As commonly seen in summer months when the bulk of the rainfall comes from scattered showers and thunderstorms, some locations saw multiple bouts of heavy rain while others often missed out. As seen in Figure 1, monthly rainfall varied by a factor of two or greater within 10 to 20 miles. Locations seeing the most July rain included Brick Township (Ocean County) where one part of town saw 12.99” and two other spots 11.98” and 10.88”. Other hefty totals included four Flemington (Hunterdon) gauges with 12.22” to 11.00”, Columbus (Burlington) 12.03”, Jackson Township (Ocean) 11.73”, Riverton (Burlington) 11.68”, Raritan Township (Hunterdon) 11.59”, and 15 other CoCoRaHS and NJWxNet sites from 10.00”–10.99”. Several locations saw below-normal July rainfall, including Lower Alloways Creek Township (Salem) with only 2.50”, West Cape May (Cape May) at 3.62”, and Ocean City (Cape May) 3.71”. Other low totals included Middle Township (Cape May) with 4.23” and 4.25” reports, and New Brunswick (Middlesex) 4.89”.

Figure 1. July 2021 precipitation across New Jersey based on a PRISM (Oregon State University) analysis generated using NWS Cooperative and CoCoRaHS observations from 7 AM on June 30th to 7 AM on July 31st. Note the scale in inches at the bottom of the figure. Totals range from 3.00”–4.00” (red) to 11.00”–12.00” (dark green).
Afternoon and evening thunderstorms on the 1st hit southern areas hardest, particularly from Gloucester County northeast into northern Ocean County. Upper Deerfield (Cumberland) was pounded with 3.05”, three Medford Township sites had 2.36”–2.80”, Jackson Township 2.68”, Washington Township (Gloucester) 2.44”, and two Brick Township locations with 2.43” and 2.41”. Fifteen CoCoRaHS locations had greater than 2.00” and 99 from 1.00”–1.99”. This evaluation is based on approximately 250 daily reports, a common number of observations this month. Winds gusted to 53 mph in Woodbine (Cape May), 49 mph at Dennis (Cape May), and 40 mph in Pennsauken (Camden). Downed trees and wires were reported in Cape May, Cumberland, Salem, and Monmouth counties.
Scattered showers on the 2nd, particularly in southern, northwest, and northeast locations brought as much as 2.41” to Kearny (Hudson), Oswego Lake (Burlington) 2.09”, Pennsauken 1.90”, Knowlton Township (Warren) 1.70”, Northfield (Atlantic) 1.58”, and West Milford (Passaic) 1.58”. More rain arrived on the late afternoon and evening of the 3rd, ending early on the 4th. Rain coverage was quite localized in the south and northwest, amounting to 1.29” at Galloway (Atlantic), 1.10” in Port Republic (Atlantic), and 1.04” in both Piney Hollow (Gloucester) and White Township (Warren).
A squall line raced through northern counties before stalling in central NJ during the late afternoon and evening of the 6th. Seventeen CoCoRaHS stations saw at least 2.00” and 74 others from 1.00”–1.99”. Top honors went to a Long Branch (Monmouth) station with 3.50”, with another at 2.68”, 3.20” fell in Matawan (Monmouth), and 2.95” at Manchester Township (Ocean). One quarter inch diameter hail fell in Sussex County. Winds gusted as high as 61 mph in Sea Girt (Monmouth) and exceeded 40 mph at High Point Monument (Sussex; 59 mph), Hopewell Township (Mercer; 47 mph), Pittstown (Hunterdon; 42 mph), Hillsborough-Duke (Somerset; 41 mph), and Silas Little (Burlington; 40 mph). Tree, wire, and some structural damage was reported in eight northern and central counties.
A three-part onslaught of heavy rain soaked the Garden State from the morning of the 8th through the 9th. Part one included severe thunderstorms in sections of north Jersey during the afternoon of the 8th. Over 4” of flash-flood-producing rain fell in Bergenfield (Bergen) and hail as large as 2.5” in diameter fell at some locations (Figure 2).

Figure 2. Hail stone that fell in Hillsdale (Bergen) on July 9 (courtesy of C. Gerbig as posted on Facebook).
Part two arrived in south Jersey later in the evening in the form of Tropical Storm Elsa. This storm had traveled through the Caribbean, at times as a hurricane, into the Gulf of Mexico, again briefly achieving hurricane status, made US landfall in Florida, then weakened moving across the Southeast, before regaining some strength as it moved into the Atlantic off the East Coast. It then traveled north just off the Jersey coast bringing a wind gust of 75 mph at the Harvey Cedars (Ocean) NJWxNet station on Long Beach Island, and gusts from 40–44 mph at Atlantic City Marina (Atlantic), West Cape May, Seaside Heights (Ocean), Logan Township (Gloucester), and Lower Alloways Creek Township. A report of a 79-mph gust in Sea Isle City (Cape May) was observed at a WeatherFlow station. Minor tree and wire damage was reported in six counties. Several inches of rain fell in coastal counties, with totals decreasing toward the Delaware Valley. Elsa also generated two tornadoes. The first arrived at 2:40 AM on the 9th in Woodbine. Rated an EF1 with winds to 100 mph it was on the ground for 0.94 miles and had a maximum width of 75 yards. The second twister touched down at 3:33 AM in Little Egg Harbor Township (Ocean). Rated EF0 with winds as strong as 80 mph it was on the ground for 0.29 miles and had a maximum width of 110 yards. There was some tree and structure damage from each with no injuries reported.
The final chapter of these wet and windy two days brought heavy evening thunderstorm rain to north and central areas, especially Warren County. Given the timing of the various portions of this trilogy, rainfall totals from the morning of the 8th into early on the 10th were combined and are shown in Figure 3. Rainfall totals topped out at 4.73” in Bergenfield, with Rockaway Township (Morris) at 3.88”, Chatham (Morris) 3.59” and 3.33” (two stations), Denville (Morris) 3.52”, and Tenafly (Bergen) 3.37”. Thirty-two stations had 3.00”–3.99”, 98 from 2.00”–2.99”, and 101 from 1.00”–1.99”.

Figure 3. Rainfall from approximately 7 AM on July 8th to 7 AM on July 10th based on a PRISM (Oregon State University) analysis generated using NWS Cooperative and CoCoRaHS observations. Note the scale in inches at the bottom of the figure.
The 12th brought some early showers to north Jersey, but the heavy rain waited until the afternoon and was focused on western Burlington and also in northern Morris, Passaic, and Sussex counties (Figure 4). The former location was on the eastern side of a stationary storm that brought as much as 10.00” on the Pennsylvania side of the Delaware River in Bucks County. In NJ, it put down 4.93” in Riverton, 3.92” in Burlington (Burlington), and 3.45” and 3.01” at two Pennsauken locations. Up north, Charlotteburg (Passaic) caught 4.13”, Ringwood (Passaic) 3.68”, Bloomingdale (Passaic) 3.62”, and Montague (Sussex) 3.27”. Elsewhere, 2.00”–2.99” fell at eight locations, and 1.00”–1.99” at 37 others. Hail up to an inch in diameter was reported in Ocean County, with some localized tree and wire damage from strong winds in seven counties scattered around the state.

Figure 4. Rainfall from approximately 7 AM on July 11th to 7 AM on July 13th based on a PRISM (Oregon State University) analysis generated using NWS Cooperative and CoCoRaHS observations. Note the scale in inches at the bottom of the figure.
The northern portion of Monmouth County was the focal point of some modest rain on the 14th. Middletown stood out with 1.71”, while the next largest reported total was 0.82” in Red Bank. A small but strong storm occurred in northern Sussex County on the 16th. A 64-mph gust in Vernon Township was associated with what was likely a nearby microburst that brought down a number of trees. Wantage received 2.13” of rain and Sandyston 1.14”.
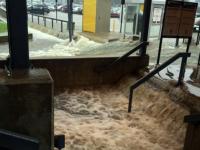
The next potent event impacted areas in the northeast during the afternoon of the 17th and then into the evening, mainly in Hunterdon County, before finally finishing in Burlington County. The early storm brought localized 1” diameter hail and flash flooding in the Newark (Essex) region and a 58-mph gust at Newark-Liberty Airport (Essex). Later, a near stationary complex of thunderstorms brought frequent lightning, hail up to an inch in diameter at Lambertville (Hunterdon), and a deluge of rain in southeastern Hunterdon County. Rainfall totals in Hunterdon County included four Flemington gauges catching 6.11”, 5.64”, 5.47”, and 4.21”, Raritan Township 4.04”, and Kingwood, 3.96”. Nearby, Pennington (Mercer) caught 3.38” and Branchburg (Somerset) 3.21” (Figure 5). Flash flooding ensued on the South Branch of the Raritan River and its tributaries. The stream gauge downstream within the 25.7 square mile Neshanic River basin saw a rapid discharge rise from 8 cubic feet per second to a maximum of 6,810 cubic feet per second (Figure 6). This compares with the all-time maximum over the past 89 years of 10,300 cubic feet per second on September 16, 1999, during Hurricane Floyd. The gage height at this station rose 11 feet during the late evening of the 17th. Water rescues were undertaken at several locations (Figure 7) as they had been in Newark earlier in the day.
As the central storms moved south later in the evening, a tornado was spawned in Springfield Township (Burlington). Touching down at 10:25 PM, this EF1 tornado, with winds as high as 80–90 mph, damaged trees along its 7.9-mile path and had a maximum width of 800 yards. Fortunately, no significant injuries were reported from this or any of the other storms on the 17th. In addition to the previously mentioned rainfall totals, 20 locations caught 2.00”–2.99” and 68 sites from 1.00”–1.99”. Also, straight-line winds gusted to 55 mph at Pittstown, 42 mph in Lower Alloways Creek Township, 41 mph in Columbus, Cream Ridge (Monmouth), and Pennsauken, and 40 mph at Fortescue (Cumberland). Tree and wire damage was reported in Burlington and Camden counties.

Figure 5. Rainfall from approximately 7 AM on July 17th to 7 AM on July 18th based on a PRISM (Oregon State University) analysis generated using NWS Cooperative and CoCoRaHS observations. Note the scale in inches at the bottom of the figure.

Figure 6. Discharge of the Neshanic River in Reaville (Hunterdon) on July 17th and 18th. Note the non-linear discharge scale (courtesy of USGS).

Figure 7. Flash flooding on New Hampton Road in Raritan Township on July 17 (courtesy of R. Maxwell, NJ Advance Media).
Next up were late morning and afternoon thunderstorms in south and lower central locations on the 21st. West Creek (Ocean) was hit hardest with 3.28”, three Stafford Township (Ocean) locations caught from 1.65”–2.42”, Brigantine (Atlantic) saw 1.66”, Galloway 1.52”, and 13 locations from 1.00”–1.49”. Hailstones with diameters of 1.00” –1.25” fell in portions of Camden, Ocean, and Atlantic counties. Winds gusted to 53 mph at Harvey Cedars, 42 mph in Pennsauken, and 40 mph at Sea Girt, with reports of tree and wire damage in the storm region. The 27th brought evening thunderstorms and showers that ended in the pre-dawn hours of the 28th. Rain fell mainly in the north with Vernon Township receiving 1.24” and Sparta (Sussex) 0.94”. High Point Monument had a 42-mph gust.
As if July hadn’t already provided enough excitement, along came late afternoon and evening supercell thunderstorms on the 29th that put the day and month into the weather record books. These storms generated five tornadoes in south central and central coastal Jersey. This tied with March 10, 1964, for the second most tornadoes in a day. Only November 16, 1989, with seven, has seen more. The five twisters put the total number for the month to eight, which ties with July 1987 and November 1989 as the most for any month since 1950. Eight is the count to date for 2021 and even should no other tornadoes occur this year, this ties with 1973 and 1990 as the fourth most in a year, trailing 1989 (17), 2019 (10), and 1987 (9).
The first tornado touched down in Verona (Essex) at 5:54 PM. It was a short-lived storm rated as EF0 with an estimated peak wind of 65 mph. Over a few minutes it traveled 0.35 miles and had a maximum width of 50 yards. It felled trees, one of which severely damaged a house.
At 5:59 PM a tornado touched down in New Hope, PA, then crossed the Delaware River at Washington’s Crossing (Mercer) and, after 15 minutes and 6.4 miles on the ground, lifted in Hopewell Township. It was rated EF2 with maximum winds of 125 mph and a maximum width of 400 yards. It did considerable tree damage along its path.
The third NJ tornado touched down at 6:56 PM and had a 5-minute, 1.6 mile long, and 100-yard-wide track through Robbinsville (Mercer). It was rated EF1 with a maximum wind speed of 105 mph. Tree and some structural damage occurred along its path.
The fourth twister touched down at 8:04 PM and had a 4-minute, 0.76-mile-long and 80-yard-wide track within Jackson Township (Ocean). It was rated EF0 with a maximum wind speed of 80 mph. Located in a heavily wooded area, it only damaged trees.
A short while later, an EF1 tornado with 105 mph wind touched down at 8:42 PM in Woodland Township (Burlington) and, over 10 minutes, traveled 1.6 miles with a maximum width of 100 yards until dissipating in West Wells (Ocean). There was considerable damage to trees along its path.
The final tornado of the outbreak was the most damaging in New Jersey. It touched down on the mainland in far eastern Barnegat Township at 9:03 PM, quickly moved into Barnegat Bay as a waterspout, then came ashore in the High Bar Harbor area of Long Beach Township on the northern end of Long Beach Island and lifted off the ground 10 minutes later before reaching the ocean side of the island. This storm was rated EF2 with 115–120 mph maximum winds. It was on the ground or over water for 4.2 miles and had a maximum width of 75 yards. Considerable damage occurred in High Bar Harbor, with roofs fully or partially blown off several homes, other structural damage, boats and sheds tossed about, and trees down. Several minor injuries were caused by broken glass.
In addition to the tornadic winds, there were reports of wire and tree damage from strong straight-line winds in Essex, Somerset, Burlington, and Ocean counties. However, no NJWxNet stations reported a gust exceeding 38 mph, including at several that are situated within a few miles of one of the tornadoes. Hail up to 1.5” in diameter fell at locations in Burlington and Camden counties. Localized heavy rain and flash flooding also accompanied these storms. Plainsboro (Middlesex) received 3.65”, two Princeton (Mercer) stations had 3.35” and 2.73”, West Windsor (Mercer) 3.25”, Jackson Township 3.20”, Pennington 3.08” and 2.97” (two stations), and Hopewell (Mercer) 2.99” (Figure 8). All told, 19 CoCoRaHS stations reported 2.00”–3.65” and 62 from 1.00”–1.99”.

Figure 8. Rainfall from approximately 7 AM on July 29th to 7 AM on July 30th based on a PRISM (Oregon State University) analysis generated using NWS Cooperative and CoCoRaHS observations. Note the scale in inches at the bottom of the figure.
Highest barometric pressures for July were in the 30.20”–30.25” range on the 13th. Lowest values were found along the coast as Elsa passed early on the 9th and were in the 29.55”–29.60” range, while the rest of the state ranged from 29.60”–29.80”. The 2nd and 30th each had statewide pressure observations between 29.65”–29.75”. The six July days with NJWxNet stations recording gusts of 40 mph or greater were all discussed in the above storm narratives.
Smoke
On multiple July days, smoke invaded New Jersey skies from forest fires in the western United States and western and south-central Canada. Most notable at sunrises and sunsets where the sun looked like a red rubber ball, on several days, skies were a milky white and the sun dimmed. This included the 7th, 20th–21st, and 27th–28th. On the middle pair of days, not only were microscopic smoke particles found upwards of 30,000 feet above the surface, but they also migrated toward the surface, greatly reducing visibility and resulting in some of the unhealthiest air in this region in a number of years. Figures 9 to 11 depict the intense smoke conditions over New Jersey and across North America on these two days.

Figure 9. A visible satellite image of the middle latitudes on the northern western hemisphere on July 20, 2021. Smoke from western forest fires can be seen among clouds near the US-Canadian border in the west and dominates the sky over the Midwest in the Mid-Atlantic states (image courtesy of NOAA).

Figure 10. A close-up view of the smoky skies over New Jersey and surrounding areas at 10:55 AM EDT on July 20, 2021 (image courtesy of NOAA).

Figure 11. Black carbon column mass density is depicted in this satellite-derived product on July 21, 2021, across the same general region of Figure 9. Densities are greatest near the origin of fires in the West, in the upper Midwest, and across Pennsylvania and New Jersey (image courtesy of NASA).
Temperature
The daily maximum temperature equaled or exceeded 90° at one or more NJWxNet station on 14 July days. All but six NJWxNet stations reached 90° at least once, the exceptions being higher-elevation sites including High Point Monument (86° maximum), High Point (Sussex; 89°), Wantage (88°), Vernon Township (87°), and coastal stations at Atlantic City Marina (89°) and West Cape May (88°).
Cape May Court House (Cape May) reached 90° on the 1st. The 6th found East Brunswick (Middlesex) and Jersey City (Hudson) up to 95° and 47 NJWxNet stations from 90°–94°. Atlantic City Marina only made it up to 79° on the 6th. The 7th was the hottest day of the month, with East Brunswick at 96°, eleven stations at 95°, and 43 sites from 90°–94° (Figure 12). West Cape May and High Point Monument were “coolest” at 85°. East Brunswick, Howell (Monmouth), and New Brunswick reached 91° on the 8th.

Figure 12. Maximum temperatures on July 7th based on a PRISM (Oregon State University) analysis generated using NWS, NJWxNet, and other professional weather stations. Note the scale in °F at the bottom of the figure.
Next up was a run of six consecutive days with 90° readings, beginning on the 12th with 94° at Piney Hollow and 37 stations from 90°–93°. The 13th found Vineland (Cumberland) up to 93°. Humid air and a coastal setting along Delaware Bay resulted in Fortescue only cooling to 81° on the morning of the 13th and reaching 92° in the afternoon. This contrasted greatly with High Point Monument’s maximum of 69° and minimum of 64° on the 13th. Five stations topped out at 93° on the 14th and Sicklerville (Camden) made it to 93° on the 15th. The 16th saw five stations at 95° and 49 from 90°–94°. Rivaling the 6th for monthly top honors but not quite making it was the 17th, with Red Lion (Burlington) at 96°, eight stations at 95°, and 36 from 90°–94° (Figure 13).

Figure 13. Maximum temperatures on July 17th based on a PRISM (Oregon State University) analysis generated using NWS, NJWxNet, and other professional weather stations. Note the scale in °F at the bottom of the figure.
The 20th found Lower Alloways Creek Township at 92°. This station was again warmest at 94° on the 26th when 34 other sites were 90°–92°. Vineland hit 95° on the 27th with 41 sites from 90°–94°, and on the 30th Woodbine and Cape May Court House (Cape May) each hit 90°.
On the cool low temperature side of the ledger, 18 days found one or more NJWxNet station dropping into the 40°s or 50°s. Ten of those days mentioned below fell to 54° or cooler. The first of these was the 3rd, with High Point Monument at 52°, High Point 53°, and Vernon Township 54°. The two coolest stations on the 4th were in the south when both Woodbine and Berkeley Township (Ocean) bottomed out at 54°. Northwest valleys were coolest on the 5th with both Sandyston and Walpack (Sussex) at 53°. It was not until the 22nd that sub-55° temperatures returned, when Walpack fell to 50° and Sandyston 52°. Walpack dipped to 48° on the 23rd, Sandyston 50°, and Pequest (Warren) 51°. Sandyston took low honors on the 24th with 51°, with Walpack 52°, Pequest 53°, and Basking Ridge (Somerset) 54°.
July finished with a cool flourish, beginning with Walpack reaching 54° on the 28th. The 29th had Sandyston and Walpack at 52°. Walpack fell to 49°, Sandyston 51°, and Wantage 53° on the 30th, while Harvey Cedars had a low of 73°. The 31st was an unusually cool July morning across the state. Walpack was a chilly 43°, Sandyston 44°, seven stations were from 47°–49°, and 23 from 50°–54°. Harvey Cedars, Atlantic City Marina, and Logan Township (Gloucester) were mildest at 64°.

Figure 14. Minimum temperatures on July 31st based on a PRISM (Oregon State University) analysis generated using NWS, NJWxNet, and other professional weather stations. Note the scale in °F at the bottom of the figure.


