
As climatological summer and the Atlantic hurricane season begin on June 1, scientists are carefully monitoring sea-surface temperatures in the tropical Pacific Ocean for a potential El Niño event. An El Niño occurs when warmer-than-average waters start to form in the eastern Pacific Ocean, specifically near the equatorial latitudes. Easterly winds (blowing from the east) typically move warmer water to the western Pacific (near Indonesia), permitting cooler water to upwell to the surface in the east (near South America). When these winds are weaker, or if they reverse direction, the warm water stays in the eastern Pacific. This difference in sea surface temperatures and winds creates a new dynamic between the ocean and atmosphere, distinctly affecting weather patterns across the world. No two El Niño events are alike; they vary in magnitude and location of the largest temperature anomalies. El Niño events can be classified as Strong, Moderate or Weak.
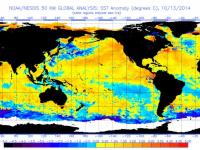
Scientists monitor the oceans through a network of buoys and formulate a forecast for El Niño events. Figure 1 shows current sea surface temperature anomalies globally, indicating a growing positive departure from normal in the eastern equatorial Pacific. An El Niño has yet to be declared, as conditions need to be present for three consecutive months to be considered an official event. NOAA has launched a blog to discuss this apparently unfolding event. Confidence is steadily increasing that an El Niño will occur this year.
 anomalies for May 29, 2014. NOAA/NESDIS.")
Figure 1. Sea Surface Temperature (SST) anomalies for May 29, 2014. NOAA/NESDIS.
So What About New Jersey?
What might this mean for New Jersey’s weather? The Office of the New Jersey State Climatologist has evaluated historical weather observations to see how past El Niño events have impacted seasonal temperature and precipitation. Time series of statewide temperature and precipitation were generated for the summer season (June, July, and August) for the 63 years between 1951 and 2013 (figures 2 and 4 below). Conditions during the 18 El Niño summers could then be analyzed, relative to the full period distribution of these variables. The percentage of El Niño summers within the lower, middle and upper terciles (thirds) of the 63 summers are plotted in figures 3 (temperature) and 5 (precipitation) below. Since the existence and potential magnitude of an El Niño event is still uncertain, these values are averaged over all three categories of strength.
Summer Temperatures in New Jersey
Temperatures in New Jersey have a tendency to be cooler during El Niño summers, 39% of El Niño summers have temperatures falling within the lowest tercile, (below 71.4°F). 33% of El Niño summers fall within the middle tercile (between 71.4°F and 72.6°F), while 28% were recorded in the warmest tercile (above 72.6°F). Two of New Jersey’s coolest summers (within the bottom 10%) since 1951 occurred during an El Niño year. However, one of the warmest summers (top 10%) occurred during an El Niño year.

Figure 2. Time series of New Jersey average summer temperatures from 1951-2013. Red bars indicate years with an El Niño event. Black line indicates 5-year moving average.

Figure 3. Distribution of average summer temperatures from 1951-2013, representing percentage of El Niño summers falling within each tercile.
Summer Precipitation in New Jersey
For precipitation, El Niño summers tend to stay close to average, with 45% of El Niño summers in the middle tercile of precipitation (between 3.67 in and 4.70 in). A third of these summers exhibit precipitation totals in the lowest tercile (below 3.67 inches), and only 22% of years have precipitation in the highest tercile. Two El Niño summers had such low precipitation amounts in New Jersey that they landed in the bottom 10% for the period, while one summer was in the top 10%.

Figure 4. Time series of New Jersey total summer precipitation from 1951-2013. Red bars indicates years with an El Niño event. Black line indicates 5-year moving average.

Figure 5. Distribution of total summer precipitation from 1951-2013, representing percentage of El Niño summers falling within each tercile.
Summary
This analysis did not show any major impacts of a developing El Niño on New Jersey’s summer climate. Nevertheless, such summers exhibit some tendency toward cooler temperatures and near-average precipitation. Should an El Niño event be officially declared this summer, keep an eye out for subsequent seasonal analyses on NJWeather.org.
Further Reading
- Current Analysis - http://www.cpc.ncep.noaa.gov/products/precip/CWlink/MJO/enso.shtml
- A more in-depth explanation of El Niño - http://www.pmel.noaa.gov/tao/elnino/el-nino-story.html
- FAQ about the El Niño - http://www.cpc.ncep.noaa.gov/products/analysis_monitoring/ensostuff/ensofaq.shtml#ENSO
- More forecasting tools - http://iri.columbia.edu/our-expertise/climate/forecasts/enso/
ONJSC intern Jack McCarty contributed to this analysis and report.
 anomalies for July 20, 2015.")


. (Credit: Dave Robinson, ONJSC)")