As we have mentioned in our past evaluations of the El Niño’s significance in the summer and fall, we are back again to analyze the wintertime impacts of a developing El Niño on New Jersey weather. An El Niño occurs when warmer-than-average waters exist in the central and eastern Pacific Ocean, specifically near the equatorial latitudes. This warming is due to a weakening of winds moving to the west, which typically transport warmer waters to the western Pacific, permitting cooler water to upwell to the surface in the east. When these winds are weaker or if they reverse direction, warm water stays in the east. The warmer sea surface temperatures in the east and the altered atmospheric flow pattern create a new dynamic between the ocean and atmosphere. The newly formed interaction sets up distinct and repetitive weather patterns across the world. No two El Niño events are alike; they vary depending on the magnitude and location of where the largest temperature anomalies are found. However, each one tends to alter weather patterns outside the overall norm.
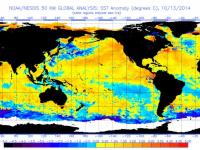
Since the past spring, scientists have monitored the oceans through a network of buoys in order to forecast the current El Niño event. Figure 1 shows current sea surface temperature anomalies globally, a variable closely examined by forecasters, and the figure shows a classic example of El Niño-like sea surface temperature anomalies. In order for an El Niño event to be declared, certain oceanic temperature thresholds need to be met over 3-month periods, for 5 consecutive periods. For instance, the temperature index that NOAA uses needs to be above a certain value for the 3 month seasons of March-April-May, April-May-June, and so forth until July-August-September. In addition, NOAA looks at the atmospheric response to the oceanic temperatures to validate if an El Niño is occurring. Confidence was high in early summer that an El Niño would occur and since then we have seen what may be a weak to moderate event unfold in fits and starts. Other countries use different definitions for an El Niño; the Japanese Meteorological Association declared that an El Niño event has been occurring since the summer according to their interpretation. For the scope of this report, we will follow the NOAA guidelines. To find a more in-depth breakdown of this El Niño, NOAA has launched a blog to discuss this developing event.

Figure 1. Global Sea Surface Temperature Anomalies on December 11, 2014.
At the time of our last report there was a 66% chance of an El Niño forming over the winter months. Since then, the confidence dropped to 58% and now it is back up to 65%. The temperature anomaly needed declare an El Niño (+0.5 degrees Celsius) has been achieved; however, it has yet to exist long enough for an event to be officially declared. Moreover, the ocean–atmosphere dynamic that is typical of El Niño is currently absent, suggesting that an El Niño hasn’t come to fruition. Forecasts suggest the temperature anomaly will remain above the threshold over the next several months. Thus it is likely that we are at the beginning of what is likely to be a weak to moderate event for this winter and spring, assuming the ocean–atmosphere dynamic is inaugurated.
So what does an El Niño event mean for New Jersey’s winter weather picture? We have evaluated historical weather observations to see how past El Niño events have impacted Garden State winter (December-February) temperatures, precipitation, and snowfall. Time series of statewide values were generated for the 63 winters between 1951-52 and 2013-14 (Figures 2, 4, and 6 below). Conditions during the 18 El Niño winters falling during that interval were analyzed relative to the full period of record. The percentage of El Niño winters falling within the lower, middle, and upper terciles (thirds) of the 63 winters are plotted for each variable (Figures 3, 5, and 7).
El Niño winters tend to be warmer than usual, with 45% of El Niños in the upper tercile (statewide average temperature above 33.5 °F). However, 33% of these winters fall in the lower tercile (below 30.7 °F). This leaves just 22% of El Niño winters in the middle tercile (30.7 °F - 33.5 °F). Two of the coolest winters (bottom 10%) and one of the warmest winters (top 10%) during the study period occurred during El Niño years.

Figure 2. Time series of New Jersey average winter temperatures from 1951-2013. Red bars indicate seasons with an El Niño event. Black line indicates 5-year moving average.

Figure 3. Distribution of average winter temperatures from 1951-2013, representing percentage of El Niño winters within each tercile.
Wintertime precipitation is either a boon or bust during El Niño winters. 50% of such winters have fallen within the lowest tercile (below 9.07”), while 44% were in the upper tercile (above 10.91”). Thus only 6% were in the middle tercile (9.07” - 10.91”). Three El Niño winters fell within the top 10% and one was in the bottom 10% of precipitation, meaning that half of our top 6 (top 10%) wettest winters are associated with El Niños. While many El Niños are on the dry side, only one was exceptionally dry.

Figure 4. Time series of New Jersey average winter precipitation from 1951-2013. Red bars indicate seasons with an El Niño event. Black line indicates 5-year moving average.

Figure 5. Distribution of average winter precipitation from 1951-2013, representing percentage of El Niño winters within each tercile.
Some 39% of El Niño winters are in the upper tercile with seasonal snowfall totals exceeding 23.1”. A third of the El Niño winters had snowfall amounts in the lower tercile (below 13.8”) and the remaining 28% of winters were in the middle tercile (13.8" - 23.1”). Four El Niño winters ranked in the top 10% for snowfall and two El Niño winters ranked in the bottom 10% for snowfall.

Figure 6. Time series of New Jersey average winter snowfall from 1951-2013. Red bars indicate seasons with an El Niño event. Black line indicates 5-year moving average.

Figure 7. Distribution of average winter snowfall from 1951-2013, representing percentage of El Niño winters within each tercile.
So to sum up, in the 18 El Niño winters in New Jersey since 1951, 75% had statewide temperatures near or above the full 63-year average. Precipitation had only a 6% chance of being close to average and just a slightly greater chance of being well below average compared to well above average. Snowfall during El Niño showed little variation from the overall distribution. Stay tuned for an evaluation of spring conditions across the Garden State should El Niño officially become established over the next few months.
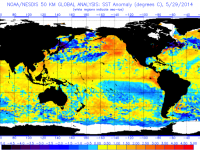

 anomalies for July 20, 2015.")