For the 12th consecutive year, we in the state climate office have evaluated the myriad daily, monthly, and annual observations gathered across New Jersey during the course of the year to choose what we feel were the most significant and impactful 10 weather and climate events. More about each event can be found in the monthly narratives posted on our website. You might be tempted to rearrange the rankings, particularly as some of the events on the list may have affected you more than others ranked higher. Or perhaps you best recall one that didn't make the list. That's the enjoyment and frustration of lists! Unless stated otherwise, statewide values are based on an average of several dozen stations. The period of record for monthly, seasonal, and annual departures is 1981–2010; while for extremes and rankings it is from 1895–present. Observations are mainly drawn from National Weather Service Cooperative Observing Program stations, Rutgers NJ Weather Network stations, and NJ Community Collaborative Rain, Hail and Snow Network locations.
- Warmth prevails
- Annual:
- Second warmest year of the past 126 (only 2012 was warmer).
- Statewide average temperature of 55.4° was 2.5° above average.
- 11 of the 15 warmest years have occurred since 2000.
- Seasonal:
- Winter (Dec 2019-Feb 2020) 7th warmest.
- Summer (Jun–Aug) 2nd warmest.
- Fall (Sep–Nov) 6th warmest.
- Monthly:
- 10 months above average.
- 6 months in the top 10 for warmth.
- July hottest of any month on record.
- Tropical Storm Isaias (August 4)
- Maximum wind gust (tornadic): 109 mph in Mud City (Stafford Township, Ocean County).
- Maximum wind gust (non-tornadic): 71 mph in Fortescue (Cumberland).
- Two EF1 tornadoes: Upper Township (Cape May), Mud City.
- Maximum rainfall: 7.86” in Salem (Salem).
- Lowest pressure: 29.38” at Lower Alloways Creek Township (Salem).
- One million customers lost power (most since Sandy).
- Snow drought, but…
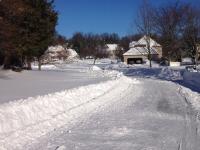
- 2019/2020 snow season 3rd lowest statewide average (4.7”; 20.8” below average) and lowest in south Jersey (0.6”; 18.7” below average).
- But…
- May 9 latest measurable spring snow since May 9, 1977. 1.0” at High Point Monument (Sussex), with less elsewhere.
- October 30 snowfall: 2.7” at High Point Monument and Highland Lakes (Sussex).
- Days between last spring and first fall measurable snowfall likely close to a record, if not a record short interval (records too incomplete to be certain).
- A number of locations surpassed their 2019/2020 seasonal total with the snow event on December 16-17.
- Seasonal confusion
- May 8–10 cold spell:
- Perhaps the coldest May interval on record.
- May 9 saw temperatures below freezing at 19 NJWxNet stations.
- High Point Monument down to 24°. A morning gust to 50 mph produced a 3° wind chill. The daytime high was only 36°.
- Afternoon snow squalls were observed in northern and central locations.
- The best any station could do for warmth on the 9th was 51° at Sicklerville (Camden) and Cape May Court House (Cape May).
- November 5–11 warm spell:
- Each day had one or more NJWxNet station with a maximum of 72°–82°.
- November 8 was one of the warmest, if not the warmest day for so late in the season. Basking Ridge (Somerset) reached 82° and 11 sites were 80°–81°.
- The first five days of the warm spell led to impressive diurnal temperature ranges at Walpack (Sussex) of 39°–50°.
- The New Brunswick (Middlesex) joint Coop and NJWxNet station achieved record high temperatures from the 7th–10th (records 1912–present). 80° on November 8 was the warmest for so late in the season.
- Tropical Storm Fay and friends
- Fay (July 10):
- Landfall near Little Egg Harbor (Atlantic).
- First NJ landfalling tropical system since TS Irene (2011).
- Maximum rainfall: 6.23” in South Harrison (Gloucester).
- Maximum wind gust: 57 mph in Sea Girt (Monmouth).
- Minimum pressure: 29.50” at Berkeley Township (Ocean).
- Friends:
Five other tropical systems besides Fay and Isaias had minor to modest impacts within NJ, including surf and offshore waters. These systems and maximum rain, highest gust, and lowest pressure are listed below.- Laura (August 29): 4.92”, 33 mph, 29.50”
- Sally (September 18–19): 0.74”, 35 mph, 29.90”
- Beta (September 27–28): 0.51”, 29 mph, 29.85”
- Delta (October 11–12): 4.90”, 42 mph, 29.95”
- Zeta (October 29–31): 4.06”, 45 mph, 29.30”
The seven combined tropical storm “visits” is an unusually high number in what was the Atlantic basin’s most active season on record.
- Severe weather potpourri
- Four tornadoes: see Isaias, #2 above, for information on two of them. The others occurred on April 21 (EF0) in Normandy Beach (Ocean) and August 19 (EF0) in Lincroft (Monmouth).
- Derecho (June 3):
- Crossed the northern half of southern NJ in less than an hour.
- Peak gust: 87 mph in Brick Township (Ocean).
- Gusts from 50–70 mph in six other counties.
- Twelve 4.00” or greater rainfall events:
- Three exceeded 6.00”: 7.86” in Salem on August 4, 6.23” in South Harrison on July 10, and 6.02” in Ocean City (Cape May) on August 10.
- Sewell (Gloucester) received 4.34” in 75 minutes on June 20. 3.99” fell in one hour, which has a return period of around 1000 years. Mantua Creek in Pitman (Gloucester) rose over 5 feet in minutes, with the discharge passing a local USGS gaging station increasing 80 fold.
- Large hail: 1.00”–1.75”diameter: June 29 Bergen County, July 1 Cape May County, and July 6 Bergen, Mercer, and Ocean counties.
- Wind and more wind
- 107 days over all months had at least one day with winds gusting to 40 mph at one or more NJWxNet station.
- 40 days over 10 months had a gust over 50 mph.
- 19 days over 9 months had a gust over 60 mph.
- 7 days over 4 months had a gust over 70 mph, namely:
- 109 mph Mud City (Stafford Township), August 4
- 89 mph Upper Deerfield, August 7
- 87 mph Brick Township, June 3
- 82 mph Island Beach State Park (Ocean), April 13
- 76 mph Sea Girt, April 21
- 75 mph Berkeley Township, August 3
- 73 mph Cape May Harbor (Cape May), February 7
- 71 mph Fortescue, August 4
- December 16–17 mixed bag storm
- Most impactful nor’easter of the year.
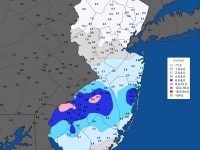
- Rain in coastal counties: maximum 3.28” in Linwood (Atlantic).
- Snow, sleet, and freezing rain inland: maximum 14.8” in Highland Lakes. Seven counties had one or more locations with 10.0” or more.
- Windy: maximum gust at Sea Girt 59 mph
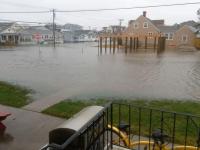
- Coastal flooding: minor to moderate
- Growing season extremes
- Defined as the number of days between the last spring freeze and first fall freeze.
- Shortest: Walpack (Sussex) 109 days, June 2–September 18.
- Longest: Atlantic City Marina (Atlantic) 262 days, March 2–November 18.
- Smoky skies
- Locally at low altitude from NJ forest fires on February 23, April 8–10, and May 19–20.
- Regionally at high altitude from western US forest fires. Most pronounced milky skies from September 15–16.


