Listed below is the Office of the NJ State Climatologist’s ranking of the top 10 weather and climate events of 2015. More about each event can be found in the monthly narratives posted on njclimate.org. You might be tempted to rearrange the rankings, particularly as some of the events down the list may have affected you more than others ranked higher. Or perhaps you best recall one that didn’t make the list. That’s the enjoyment (and frustration!) of lists. While there are a variety of events that made the list, the variable that more often than not took center scene in 2015 was the temperature. Be it warm or cold, the thermometer had stories to tell. Unless stated otherwise, observations are based on an average of several dozen stations. The period of record for monthly and annual departures is 1981–2010; while for extremes and rankings it is from 1895–present.
- Spring in December.
- Record high temperatures for the month and a number of individual days were smashed in what was a month unlike any previously observed in NJ.
- Statewide, average of 47.6° is the warmest December on record.
- The departure of +12.0° is the largest of any monthly departure recorded. It surpasses the previous record of +11.0° in January 1932.
- The maximum temperature was at or above 70° somewhere in the state on 7 days.
- Some locations set a record for consecutive days of high temperatures at or above 60° from the 10th–15th.
- Five months in top 5 for warmth or cold.
- February, with an average of 22.1° was the one month on the cold side with a departure of -11.7°. This is one of the largest negative departures of any month, the greatest being -15.6° in February 1934.
- May 66.0° (+5.2°, rank 3rd), September 70.7° (+4.5°, rank 3rd), and November 49.3° (+3.7°, rank 5th) join the 1st ranked December.
- Despite these monthly extremes, the statewide annual temperature of 53.8° was only 0.6° above average (1.5° above the 1895-2015 average). This ranks as the 18th warmest year on record.
- January–March cold.
- January–March temperatures averaged 28.5°. This is 6.3° below normal and ranks as the 3rd coldest.
- This includes departures of -3.5° in January, -11.7° in February and -5.5° in March.
- The temperature dipped below zero on 27 January–March days at Walpack (Sussex County), bottoming out at -20° on February 24th.
- Extreme minimums rivaled those in early 2014 as the coldest in NJ since the 1994 and 1996.
- On a number of days wind chills were dangerously low throughout NJ.
- Severe squall line impacts southern NJ June 23rd.
- Straight-line winds and likely several microbursts resulted in numerous trees, branches, wires, and fences being blown down.
- Gusts reached 71 mph at Hammonton (Atlantic), Mullica (Atlantic) 69 mph, Harvey Cedars (Ocean) 68 mph, and Oswego Lake (Burlington) 65 mph. Downburst winds likely exceeded 80 mph in some areas.
- Several hundred thousand customers lost power and communication networks were out for an extended period.
- The worst south Jersey damage since the June 29–30, 2012, derecho and largest power outage in NJ since Sandy in October 2012.
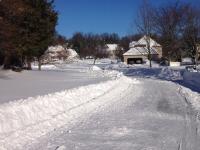
- Another snowy winter.
- Statewide average of 34.5” was only 8.3” above normal. However, in the north the average of 50.5” was +15.7” and in the central region 41.4” was +12.3”.
- There were 19 snow events where 2” or more fell in one or more locations around the state. This includes 3 in November–December 2014 and compares with a record (based on 10 years of compiling such numbers) 20 in the 2013/14 season.
- The most widespread sizeable event was on March 5th with 5.0”–9.4” over more than 90% of the state. Despite all the events, only two (11/26/14 and 2/1–2/2) had a few stations receiving as much as 10.0”.
- Cold conditions resulted in some of the most continuous snow cover on record over central and northern regions. The 48 consecutive days with two inches or greater cover at New Brunswick (Middlesex; 1893–present) was the 3rd longest on record (maximum 53 in 2011).
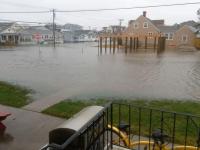
- Early October coastal flooding.
- Coastal flooding was moderate to severe from the 1st to the 5th; the worst since Sandy, but not close to approaching that event.
- Winds gusted up to 55 mph at Harvey Cedars (Ocean) and 49 mph in Sea Girt (Monmouth).
- Winds at Harvey Cedars exceeded 20 mph for 122 consecutive hours (4PM September 30th–5PM October 5th), 30 mph for 99 consecutive hours, and 40 mph for 61 consecutive hours.
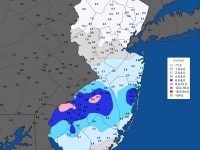
- From September 30th–October 3rd rainfall was as much as 6.77” in Lacey Township (Ocean). 79 of the 220 CoCoRaHS reports exceeded 2.00”, with 179 reports over an inch.
- This event was not directly associated with Hurricane Joaquin, rather NJ was squeezed between persistent areas of low pressure over the Southeast US and high pressure over eastern Canada. The rain was associated with waves of low pressure that moved along a stalled front between these systems.
- On the dry side.
- Statewide annual precipitation (rain and melted frozen precipitation) averaged 45.14”. This was 1.80” below normal (0.20” below the 1895–2015 average), ranking 59th driest.
- Rainfall was below average during the majority of the warm season. May (-2.88”; 3rd driest), July (- 0.63”), August (-2.01”), and September (-0.43”).
- Significant drought concerns were “saved” by 4th wettest June, with 8.29” falling (+4.27”).
- As a result of below-normal rainfall, streamflow, and ground water levels, three of the six NJ Department of Environmental Protection Water Supply Regions were placed under a Drought Watch on September 23rd. The watch continues through year’s end. Northeast NJ ends the year in D1 category (moderate drought) in the US Drought Monitor. The remainder of northern NJ is categorized as D0 (abnormally dry).
- Persistent summer warmth.
- While there were no records exceeded for days with temperatures above 90° and no location reached 100° during the year, the excessive warmth of May and September resulted in a record number of days equal to or exceeding 80° in parts of the state.
- New Brunswick equaled or exceeded 80° on 120 days. The previous record maximum was 115 days in the record hot summer of 2010. This summer included a consecutive string of 82° or higher daily maximums of 66 days that ended on September 9th. This far exceeded the previous such string of 42 days in 2010.
- The persistent warmth was accompanied by virtually rain-free weekends and holidays for the second consecutive summer.
- Local deluge.
- A thunderstorm remained stationary over western Union County on the afternoon of August 19th.
- A US Geological Survey gauge in Mountainside measured 6.31” (including 3.82” in one hour) and a CoCoRaHS observer measured 4.02” 1.1 miles away in New Providence. Meanwhile, just several miles away, little to no rain fell.
- The resulting flash flooding led to the collapse of a retaining wall at a quarry that crushed 10 cars and major flooding on Interstate 78 and State Route 22.
- Some of the memorable NJ weather and climate situations in 2015 are ones that failed to happen. For instance:
- Most forecast models predicted several feet of snow from a late January storm. The storm missed on the 27th–28th, instead burying Boston and other locations to the east with such prodigious totals.
- For a time in late September into early October, forecasts from the National Hurricane Center suggested that NJ was in the cross hairs of major hurricane Joaquin. However, atmospheric conditions, including those described under event 6 above, conspired to track the storm from the Bahamas to Bermuda and up into the north Atlantic.
- The growing season failed to end at the National Weather Service Cooperative Weather Station in Atlantic City. As of December 31, this station has not achieved a daily minimum temperature of 32° or lower during the post-summer period. The last freeze was March 29, making the growing season 277 days and counting. The latest previous freeze at this station (records back to 1874) was December 22, 2001, and the previous longest season was 274 days in 2012. This compares to the 145-day freeze-free 2015 season at Walpack (Sussex; May 25th–October 16th).


