Latest Temperatures

Current Dew Point

Latest Wind Speeds

Wind Gusts

Top Story

Looking south from Island Beach State Park toward Long Beach Island and the Barnegat Lighthouse on March 20th (photo by Dave Robinson).

So much for March flipping from lion to lamb or vice versa. March 2024 was often a lion throughout, with frequent roaring winds and multiple rain events producing a near-record monthly precipitation total and occasional flooding. The first half of the month ran at a record-warm pace, the monthly average later to be tempered by a second half that was cooler than the first. Still, the month emerged as the 9th mildest on record. Befitting the overall mild conditions, snowfall was scarce to non-existent.

Winds gusted to 35 mph or higher at one or more Rutgers NJ Weather Network (NJWxNet) station on 16 days, exceeding 40 mph on 11 of those days. Precipitation (rain and the water equivalent of the very little snow that fell) averaged 7.76” across the state. This is 3.56” above the 1991–2020 normal and ranks as the third wettest March since records commenced in 1895. The northwest was least wet with 6.00”–7.00” falling. Totals increased to the southeast where near coastal areas received 9.00”–10.00”. The northern climate division averaged 7.01” (+3.00, 6th wettest), the southern division 8.15” (+3.83”, 3rd wettest), and the coastal division 8.98” (+4.56, 2nd wettest).

The statewide average March temperature was 46.0°. This is 5.0° above normal and ranks as the 9th mildest of the past 130 years. The average high temperature of 55.6° was 4.7° above normal and ranks 10th mildest. The average low of 36.3° was 5.1° above normal and ranks 4th mildest. The northern division averaged 43.9° (+5.1°, 9th mildest), southern division 47.2° (+4.8°, 8th mildest), and coastal division 47.0° (+4.8°, 7th mildest).

Latest Extremes

City, State Temp
West Deptford, NJ 54
Cherry Hill, NJ 53
Mannington Twp., NJ 53
Logan Twp., NJ 53
Pennsauken, NJ 53
City, State Temp
High Point Monument, NJ 44
Vernon Twp., NJ 46
Chester Borough, NJ 46
Parsippany, NJ 46
Wall Twp., NJ 47
most current information as of Apr 19 9:55 PM

Latest Conditions & Forecast

New Brunswick, NJ

Rutgers University Meteorology Program

49°F

Wind

5 mph from the ESE

Wind Gust

5 mph from the E

Slight Chance Showers then Showers Likely
48 °F
Showers Likely then Mostly Sunny
65 °F
Mostly Clear
40 °F
Partly Sunny
59 °F
Partly Cloudy
40 °F
Sunny
62 °F
Mostly Clear
39 °F
Mostly Sunny
65 °F
Mostly Cloudy
47 °F
Showers Likely and Breezy
65 °F
Chance Showers then Mostly Clear
39 °F
Sunny
60 °F
Mostly Clear
38 °F
Mostly Sunny
62 °F

Tonight

Showers likely, mainly after 5am. Cloudy, with a low around 48. South wind around 5 mph. Chance of precipitation is 60%. New precipitation amounts of less than a tenth of an inch possible.

Saturday

Showers likely, mainly before 9am. Cloudy, then gradually becoming mostly sunny, with a high near 65. West wind 5 to 10 mph, with gusts as high as 20 mph. Chance of precipitation is 60%. New precipitation amounts of less than a tenth of an inch possible.

Saturday Night

Mostly clear, with a low around 40. Northwest wind 5 to 15 mph.

Sunday

Partly sunny, with a high near 59. West wind 5 to 15 mph.

Sunday Night

Partly cloudy, with a low around 40. West wind around 5 mph.

Monday

Sunny, with a high near 62.

Monday Night

Mostly clear, with a low around 39.

Tuesday

Mostly sunny, with a high near 65.

Tuesday Night

Mostly cloudy, with a low around 47.

Wednesday

Showers likely, mainly between 8am and 2pm. Mostly cloudy, with a high near 65. Breezy. Chance of precipitation is 60%.

Wednesday Night

A chance of showers. Partly cloudy, with a low around 39. Chance of precipitation is 30%.

Thursday

Sunny, with a high near 60.

Thursday Night

Mostly clear, with a low around 38.

Friday

Mostly sunny, with a high near 62.

Search by zipcode or city/state for the latest conditions, forecasts, graphs, maps and more nearest to you.

More News

Sunset at Colonial Park in Franklin Township (Somerset County) on February 15th (photo by Dave Robinson).

Perhaps the title of this report is a bit overstated when it comes to February weather conditions, but not by all that much. However, like much of the coterminous United States, it applies rather appropriately to the December 2023–February 2024 winter. New Jersey’s winter conditions follow at the end of this report, with February discussed first. February 2024 was on the dry side. In fact, the statewide average precipitation (rain and melted snow) of 1.55” was 1.31” below the 1991–2020 normal and ranks as the 12th driest since records began in 1895. The northern climate division averaged...

An ice-encased walkway and railings generated from spray from Great Falls (background) in Paterson (Passaic County) during the cold January outbreak (photo courtesy of Liz Reilly).

The first month of 2024 provided a potpourri of weather happenings, including excessive rainfall and flooding, multiple snowfalls, frequent strong winds, frigid days, occasional warmth, and culminating with persistent dismal (aka damp, cloudy) conditions. Something for anyone or perhaps not favored conditions for most people. Totaling up the multiple precipitation episodes, this month emerged as the 6th wettest January on record dating back to 1895. It was the wettest January in 25 years and follows this past December, which was the wettest on record. The statewide 6.39” of rain and melted...

Flooding from the nearby Pompton River in Wayne (Passaic County) on December 19th, 2023. Photo by Julian Leshay/NJ Advance Media.

It was a wet December, of this there is no doubt. In fact, it was New Jersey’s wettest 12th month on record, dating back to 1895. On multiple occasions, rainfall arrived in multiple-inch increments, leading to episodes of minor to major stream and river flooding. Though hardly maliciously, Mother Nature certainly left the tap flowing far too long and often! Monthly rainfall (with a little melted snowfall added to the mix in some locations) averaged 8.20” across the state (Figure 1). This was 3.93” above the 1991–2020 normal and was 0.33” above the previous wettest December in 1996 (Table...

More News

The Wind Doth Blow: March 2021 Recap

April 8, 2021 - 11:17am -- Dave Robinson

An aerial view of a wildfire in Lakewood on March 14th

With March being a transitional weather and climate month, there are often pronounced differences in conditions from one day or week to the next. The third month of 2021 did not disappoint in several such respects. Swings in barometric pressure as storms and high pressure systems swung through the Northeast led to 16 days with one or more Rutgers NJ Weather Network stations gusting to 40 mph or higher, with 11 of those days exceeding 50 mph. Maximum temperatures exceeded 65° on 12 days (two days had record highs in some locations), while minimum temperatures fell below 19° on 13 days. Walpack, situated in a Sussex County valley, recorded the state’s lowest (21°) and highest (67°) temperatures on a single day (22nd) and just missed this again on the 30th. There was a two-week interval with virtually no precipitation, culminating in several wildfires on the 14th, yet five events occurred where rain accumulated to 0.98” in one or more locations. Finally, a record of sorts was tied as the statewide average snowfall totaled 0.0”, something observed eight other Marches in the past 127 years. The past two Marches are the only ones with back-to-back zero totals.

Statewide precipitation averaged 4.03”, which is 0.18” below the 1991–2020 average*. This made for the 58th wettest (70th driest) since 1895. Northern NJ was driest, coming in at 3.28” (-0.73, 48th driest), the south averaged 4.47” (+0.15”, 42nd wettest), and the coast 4.68” (+0.26”, 38th wettest). The southeast saw the most rain and northeast and central regions the least (Figure 1).

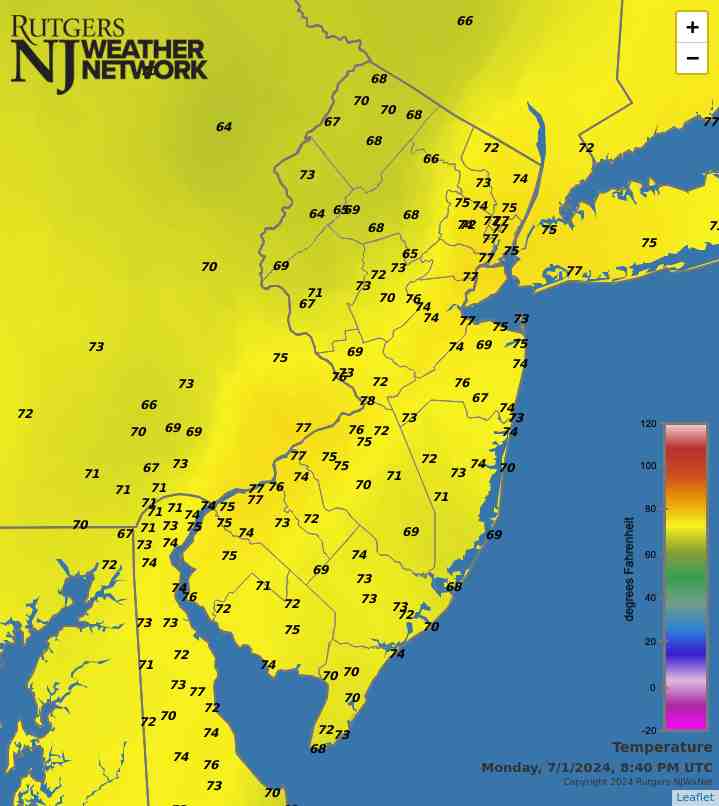
March temperature average 43.9°, which is 2.9° above the 1991–2020 average and the 14th mildest on record. The average high was 54.7° (+3.8°, 13th mildest) and average low was 33.0° (+1.8°, 19th mildest). The north averaged 41.2° (+2.4°, 19th mildest), south 45.6° (+3.2°, 13th mildest), and the coast 45.1° (+2.9°, 13th mildest).

Anything but Boring: February 2021 and Winter 2020/21 Recaps

March 8, 2021 - 3:51pm -- Dave Robinson

Wintry scene

Fate was clearly tempted when last month’s report was entitled: “Pretty Darn Boring.” Not that this wasn’t a truthful statement from both meteorological and climatological perspectives. So now this month’s title, being just as legitimate as January’s. The turnaround began in the waning hours of January 31st when what proved to be an impactful, long-lasting coastal storm began to invade the Garden State. This major event was followed by a series of storms that resulted in record or near record-setting monthly snowfall totals in northern and central regions and quite wet conditions in the south.

Statewide precipitation (rain and melted snowfall) averaged 4.89” in February. This was 2.03” above the 1991–2020 average and ranks as the 14th wettest February in 127 years of record keeping. The coastal south averaged 5.91” (+2.84”), ranking as 6th wettest. The remainder of the south came in with 5.09” (+2.20”, 11th) and the north 4.44” (+1.65”, 19th). More specifically, the southeast and central areas were wettest and the southwest and far north least wet.

While plenty of precipitation fell throughout the state, it was more often than not in the form of rain across the southern third of NJ, while central and northern areas were visited by one major snowstorm and a series of modest ones. All told, the statewide average snowfall was 23.5”. This is 15.3” above the 1991–2020 average and ranked as the 7th snowiest February.

Pretty Darn Boring: January 2021 Recap

February 9, 2021 - 10:04pm -- Dave Robinson

Snowfall map for January 3rd-4th

The first month of 2021 lacked major storms, whether wet or white, and temperatures rarely were either quite mild or very cold. Thus the title of this report. Yes, the last day of the month turned snowy, the harbinger of anything but a boring start to February, but that’s to be covered next month. The January statewide average temperature was 33.7°. This was 3.0° above the 1981–2010 normal and ranks as the 26th mildest January in the past 127 years. The average high was 41.1°, which is 1.8° above normal and ranks 34th mildest, while the average low of 26.3° was 4.2° above normal, ranking 20th mildest.

January precipitation (rain and melted snow) averaged 1.99” across the state, which is 1.41” below normal and ranks 13th driest since 1895. The north averaged 1.93” (-1.48”, 18th driest), the south 2.02” (-1.37”, 13th driest), and the coast 2.19” (-1.25”, 17th driest). Generally, the eastern half of the state was wetter (particularly the northeast) than the west.

A Mixed Bag, and A Blow Torch Year: December & Annual 2020 Recaps

January 7, 2021 - 4:43pm -- Dave Robinson

Drone photos of tidal flooding near the morning high tide on December 17th

The statewide average temperature during this last month of 2020 averaged 37.0°. This was 1.8° above the 1981–2010 normal and ranks as the 22nd mildest December in the 126-year record that dates back to 1895. Northern and southern portions of NJ had similar departures and rankings.

December precipitation (rain and the liquid equivalent of snow and sleet) averaged 6.24”. This includes rain measured at National Weather Service Cooperative Observing stations on the morning of December 1st but does not include rain measured at these stations for the 24 hours ending on the morning of January 1st. See an explanation of the November 30th–December 1st measurement in the November report. The monthly value is 2.39” above average and ranks as the 11th highest December precipitation total on record. North Jersey averaged 6.73”, which is 2.78” above average and ranks 7th wettest. The south came in at 5.89”, which is 2.10” above average and ranks 17th wettest. The coast averaged 6.43”, which is 2.67” above average and ranks 11th wettest.

ONJSC's Top 10 NJ Weather and Climate Events of 2020

January 2, 2021 - 12:51pm -- Dave Robinson

Time series of July average temperatures in NJ from 1895 through 2020

For the 12th consecutive year, we in the state climate office have evaluated the myriad daily, monthly, and annual observations gathered across New Jersey during the course of the year to choose what we feel were the most significant and impactful 10 weather and climate events. More about each event can be found in the monthly narratives posted on our website. You might be tempted to rearrange the rankings, particularly as some of the events on the list may have affected you more than others ranked higher. Or perhaps you best recall one that didn't make the list. That's the enjoyment and frustration of lists! Unless stated otherwise, statewide values are based on an average of several dozen stations. The period of record for monthly, seasonal, and annual departures is 1981–2010; while for extremes and rankings it is from 1895–present. Observations are mainly drawn from National Weather Service Cooperative Observing Program stations, Rutgers NJ Weather Network stations, and NJ Community Collaborative Rain, Hail and Snow Network locations.

The Heat Goes On: November & Fall 2020 Recaps

December 7, 2020 - 8:43pm -- Dave Robinson

CoCoRaHS rain gauge

November 2020 enters the New Jersey climate record book as the third warmest (tied with 2009). The statewide mean of 49.2° was 4.0° above the 1981–2010 normal. This month joins six Novembers from this century among the seven warmest of the past 126 years. Six of the past 12 months have ranked in the top nine for warmth. Of the first 11 months of 2020, only April and May averaged below normal. The average temperature for the first 11 months is 57.1°. This is 2.7° above normal and ranks as the second warmest such interval. Only 2012 was warmer, with both years likely to retain this ranking for the calendar year unless an extremely cold or warm December occurs, which, as this report is written, appears unlikely.

Statewide precipitation total for November was 3.91”. This was 0.30” above the 1981–2010 normal and ranks as the 43rd wettest of the past 126 years. The southern half of the state was on the wetter side of normal while the north on the dry side. This was seen in the divisional numbers that had the south come in with 4.43”, which is 0.98” above average 33rd wettest, while the north averaged 3.09”, which is 0.77” below average and ranks 78th wettest (49th driest).

A Transition Month for Sure: October 2020 Recap

November 5, 2020 - 1:52pm -- Dave Robinson

Dew spider web on the morning of October 14th in Sussex County

As the warmth of summer transitions to the cold of winter, New Jersey weather conditions can vary markedly from week to week. Such was the case during October 2020, with abundant precipitation occurring from the remnants of two hurricanes, an episode of measurable snow in the north, several weeks of quite dry conditions, a number of comfortably warm days, and the first frost and freeze of the season for many locations. Put this all together and October proved to be milder and wetter than normal. The statewide monthly average temperature of 57.2° was 2.7° above the 1981–2010 mean. This ranks as the 18th mildest (tied with 1963 and 1931) over the 126 years extending back to 1895. Southern areas were warmer than northern ones in terms of actual temperature and departure from normal. The 58.8° average in the south was 3.2° above normal and ranked 15th warmest. The north averaged 54.4°, which was 2.0° on the plus side and ranking 27th mildest.

It took a wet final week of the month to push precipitation totals to the plus side of normal. The 5.15” statewide monthly average was 1.26” above normal and ranked as the 24th wettest on record. Somewhat like temperatures, there was north-south disparity. The south averaged 5.36”, which is 1.73” above normal and ranks 20th wettest. The north averaged 4.64”, which is 0.33” above normal and ranks 36th wettest. Dry conditions prevailed, most notably in the northwest, with coastal reaches wettest. Snow fell in the north on the 30th and will be discussed below.

Up and Down But in the End Quite Average: September 2020 Recap

October 6, 2020 - 1:08pm -- Dave Robinson

Smokey sunset on September 15th

September 2020 was a month of widely-varying temperatures, several episodes of heavy precipitation, and an extended dry spell. Put it all together and conditions averaged quite close to normal. The statewide monthly average temperature of 66.8° was 1.0° above the 1981–2010 mean. While it was the seventh month of 2020 to average above normal, it was the first of these not to rank in the top 10 for warmth. Rather, it ranked 33rd warmest of the past 126 Septembers. Divisional departures from normal ranged from +0.7° in the north to +1.5° along the coast. The statewide average maximum temperature was 76.6°, which is 0.3° above normal and ranks 47th warmest. The average minimum of 56.9° was 1.6° on the warm side and ranked 24th mildest. High temperatures were likely reduced by several degrees during a mid-month period when a veil of smoke from western US forest fires blanketed the sky at an altitude of about 15,000 feet when skies otherwise would have been blue, especially on the 15th–16th. It is uncertain if this kept minimum temperatures somewhat warmer than they would otherwise have been. A cold front moved through from the northwest on the 18th, clearing the skies and sending temperatures plummeting. What followed was a four-day spell of temperatures that were well below average, including four nights with below-freezing temperatures at three to four Rutgers NJ Weather Network sites. While freezes resulting from cold air draining into valleys in some northern locations are not unprecedented before the end of astronomical summer, it is highly unusual for the cold to persist over four consecutive nights.

The Beat Goes On: August 2020 & Summer Recaps

September 7, 2020 - 9:50pm -- Dave Robinson

Sunset photo

August joined the chorus of much warmer-than-normal months experienced throughout most of 2020 to date across the Garden State. Six of the eight months have ranked among the top 10 warmest for the 126 years beginning in 1895. Only April and May are outliers and, in fact, each of them had below-average temperatures. With a mean of 75.5°, August tied with 2001 and 1955 as the 6th warmest. This is 2.5° above the 1981–2010 mean. Eleven of the warmest 17 Augusts have occurred since 2001. The mean maximum of 84.8° tied for 19th warmest at 1.5° above normal, while the mean minimum of 66.1° was 3.4° above normal and ranked 4th warmest.

Statewide precipitation averaged 6.04”. This is 1.94” above normal and ranks as the 26th wettest August on record. Above-average totals occurred in northern (6.02”), southern (6.10”), and coastal (5.50”) climate divisions. The southern division (Mercer-Middlesex-Monmouth counties and south, except a narrow coastal division) saw a range from the driest area in Monmouth and parts of Mercer counties and a very wet area in Salem and Gloucester counties.

Record Heat: July 2020 Recap

August 8, 2020 - 7:03pm -- Dave Robinson

Upper Township hail on July 1st

July 2020 was the hottest month on record for the Garden State since records commenced in 1895. The statewide average temperature of 78.8° was 4.2° above the 1981–2010 normal. This reading surpasses by 0.4° the previous record held jointly by 1955, 1999, and 2011. The next ten warmest months have occurred in July, with the warmest August averaging 76.8° in 2016, which is tied with July 1994 as the 11th warmest month on record. The average 88.9° maximum this past July was 5th warmest, the warmest occurring in 1999. The average minimum of 68.8° ranked second, trailing just 2013. The southern and coastal climate divisions had their warmest month on record while the northern division ranked second.

The statewide average precipitation this July was 6.79”. This is 2.22” above the 1981–2010 normal and ranks as the 15th wettest July on record. Looking at the state in quarters from north to south, the northernmost was driest, particularly the northwest. Next came a wet sector, followed by a more average one, with the southernmost quarter the wettest. Few locations received less than 4 inches, while scattered totals of more than 10 inches were found in the two wettest quarters.

Pages

Subscribe to Front page feed